Academic Reporting ·
A Predictor Turns Negative in the Full Model — Reading a Two-Block Regression Properly
Why a coefficient can shrink to nothing or carry a negative sign once the other predictors are in the model, and which rows of a hierarchical regression table actually answer the question. One real output read line by line. Demo data, N = 290.
Every coefficient in a multi-predictor model is an adjusted association — its value is conditional on everything else in the equation, which is why a predictor can shrink toward zero, or come back with the opposite sign, once its neighbours are included. Below is one two-block regression output read line by line, on demo data (N = 290).
What This Guide Covers
The number people quote from a hierarchical regression is the final R². It is the wrong number. The question a hierarchical model is built to answer is what the second block added, and that lives in two rows most people never look at.
This is the results-reading companion to running a hierarchical regression with categorical controls — same simulated survey, same 290-respondent sample, same two blocks. That page covers the dummy coding and the reference categories; this one covers reading the output.
The run behind it is demo data — not real thesis data. A simulated survey, uploaded as mock-data-b3-en.xlsx, cleaned down to a working sample of 290 respondents. The outcome is behavioral intention; gender, year and major go in as controls, then perceived usefulness, perceived ease of use, social influence and attitude.
Start With the Block That Failed
"Block 1, containing only the demographic controls, explained 2.9% of the variance in behavioral intention, R² = .029, adjusted R² = -.003, and was not statistically significant, F(9, 280) = 0.916, p = .511. None of the individual demographic predictors was significant in this block."
Demographics explained essentially nothing. That is a finding, and it is the baseline everything after it is measured against — a block that fails is more useful than one that is skipped, because it sets the bar the second block has to clear.
| Fit row | Layer 1 (controls only) | Layer 2 (full model) |
|---|---|---|
| R² | 0.029 | 0.326 |
| Adjusted R² | -0.003 | 0.295 |
| F value | F(9,280)=0.916, p=0.511 | F(13,276)=10.281, p=<0.001** |
| ΔR² | 0.029 | 0.298 |
| ΔF value | F(9,280)=0.916, p=0.511 | F(4,276)=30.484, p=<0.001** |
Source: ChatSRS "Hierarchical Regression Results" output on simulated survey data, N = 290 (demo data, not real thesis data). Values reproduced as printed, including the output's own p=<0.001** format.
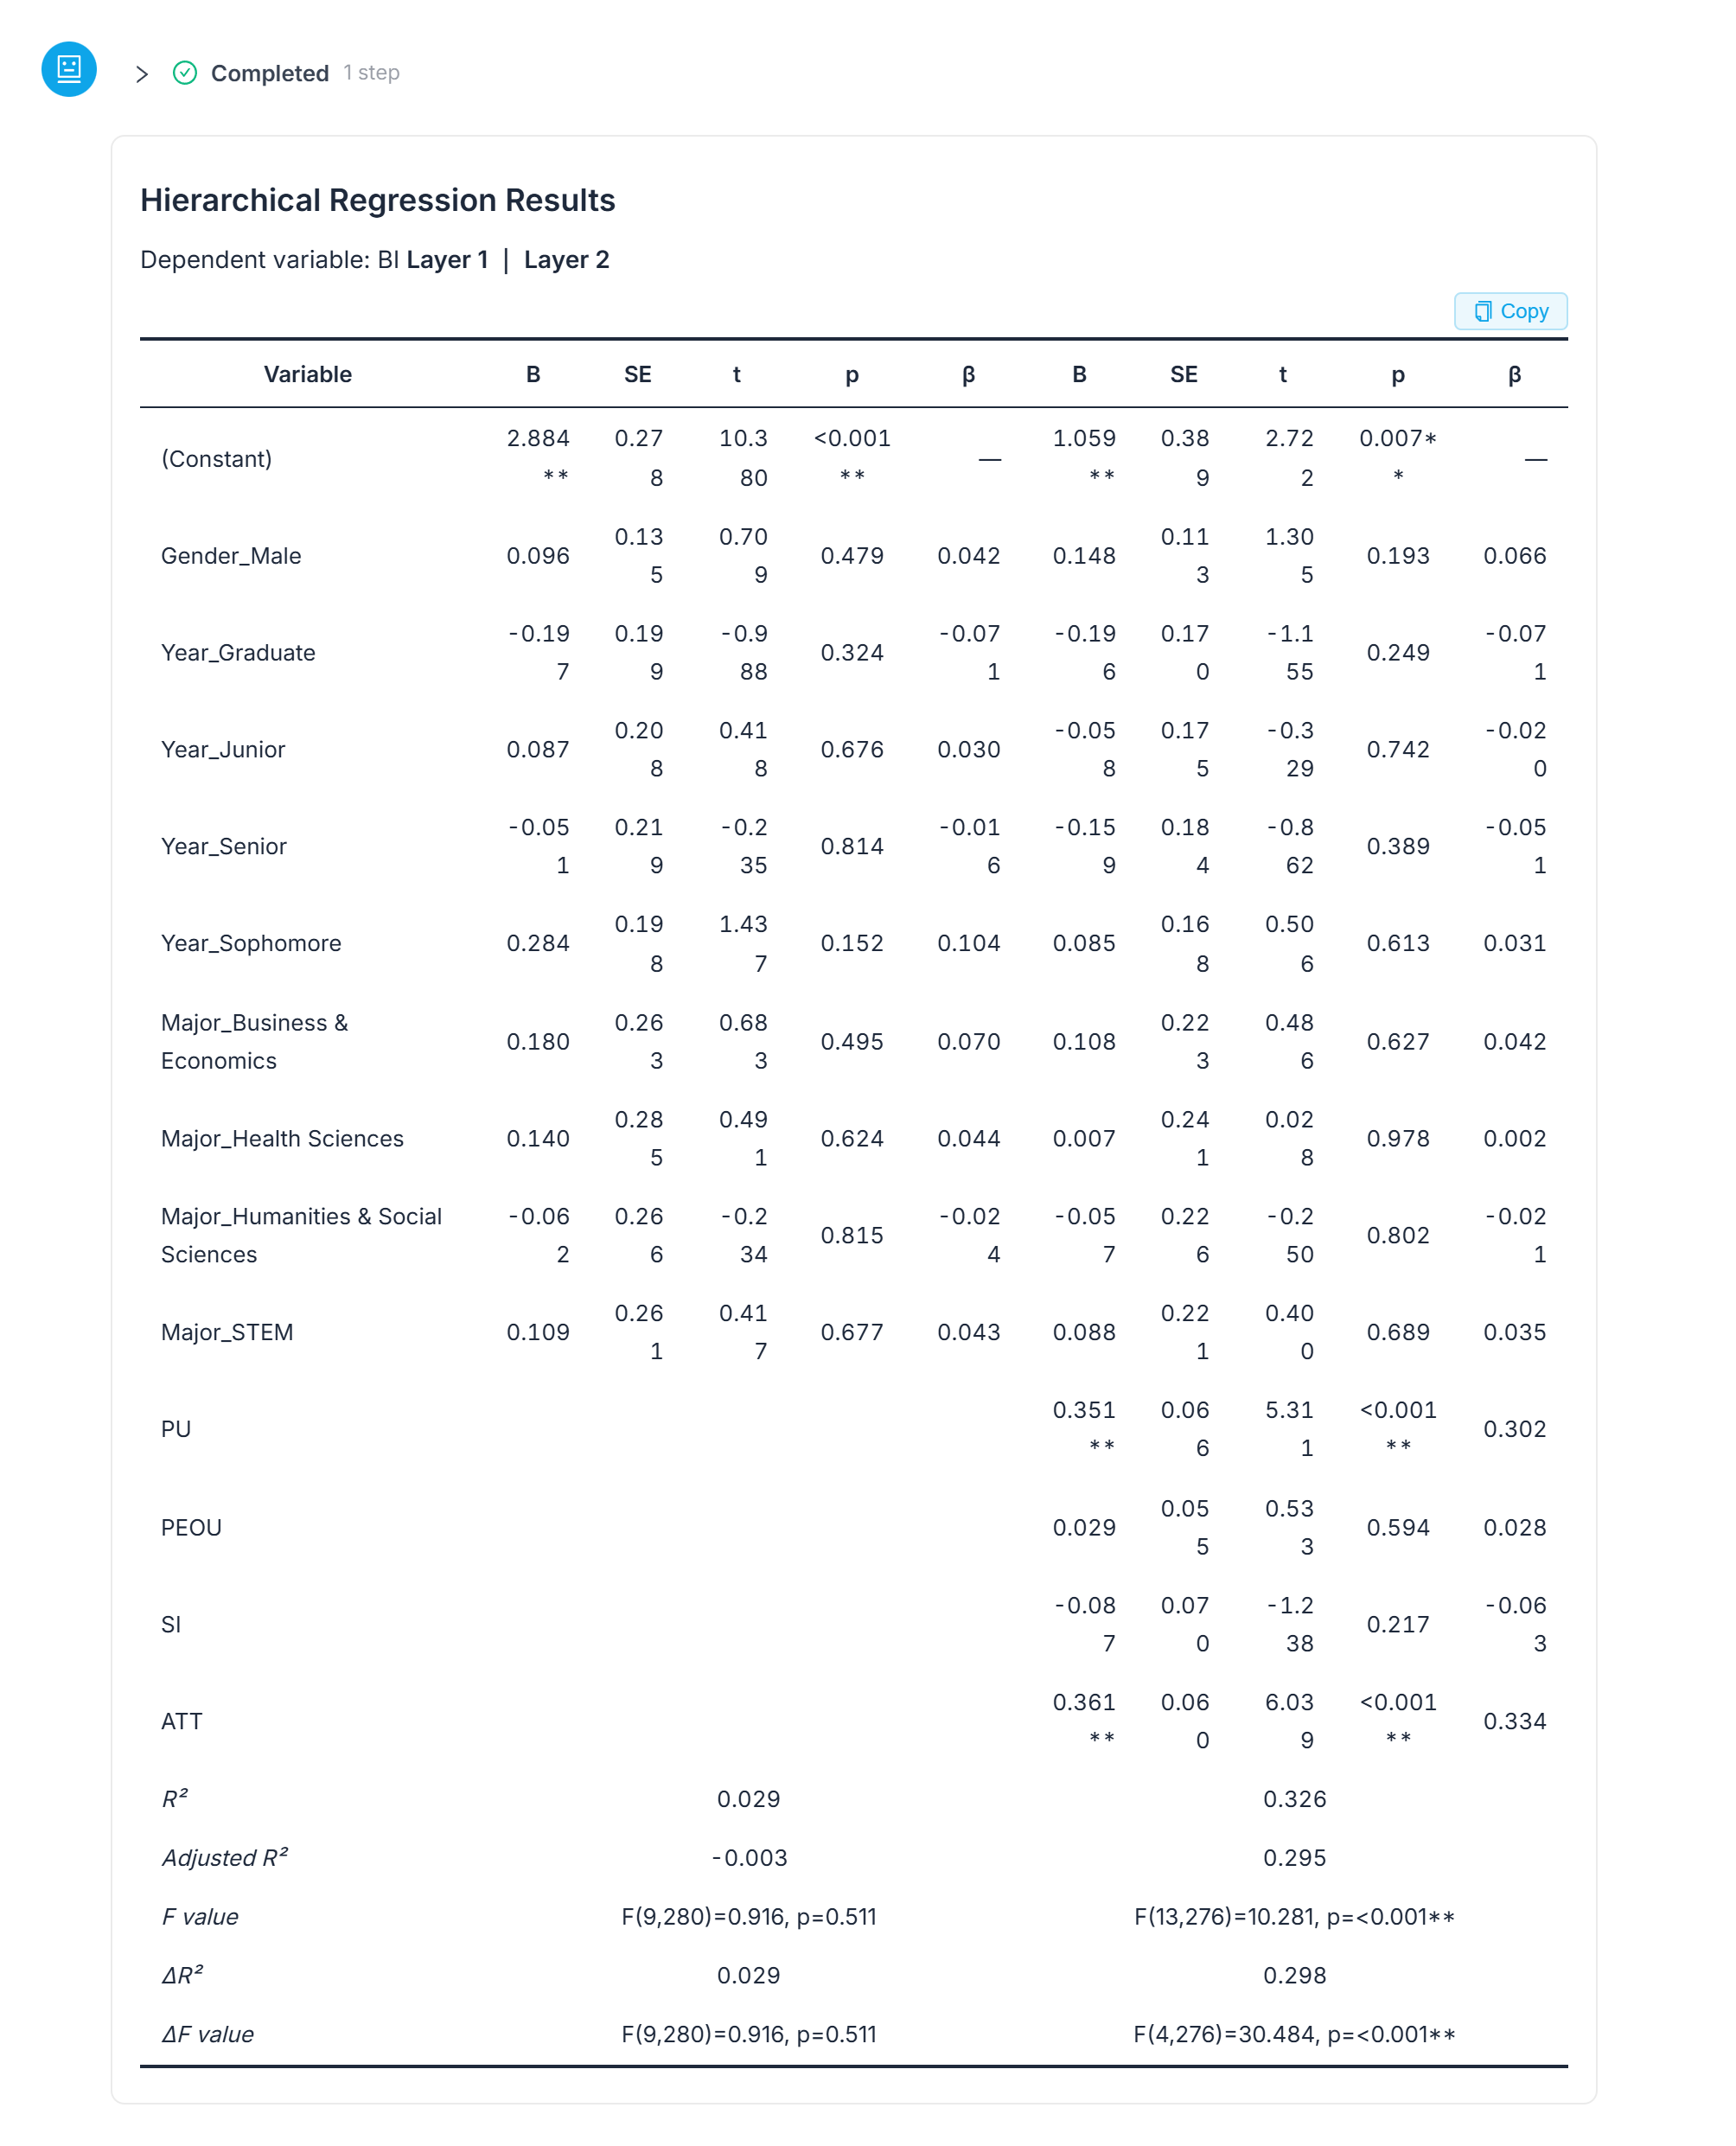 The complete grid. The claim that no demographic predictor was significant is checkable only when all nine control rows are in frame with their p columns.
The Two Rows That Answer the Question
"Adding the four psychological constructs in Block 2 increased the explained variance to 32.6%, R² = .326, adjusted R² = .295. The improvement was 29.8 percentage points, and the block-level F-change test was statistically significant, ΔR² = .298, ΔF(4, 276) = 30.484, p < .001."
ΔR² is the size of the improvement and ΔF is the test of it. R² = .326 on its own would tell you neither: it would not say how much of that came from the controls, and it would not say whether the addition was distinguishable from noise.
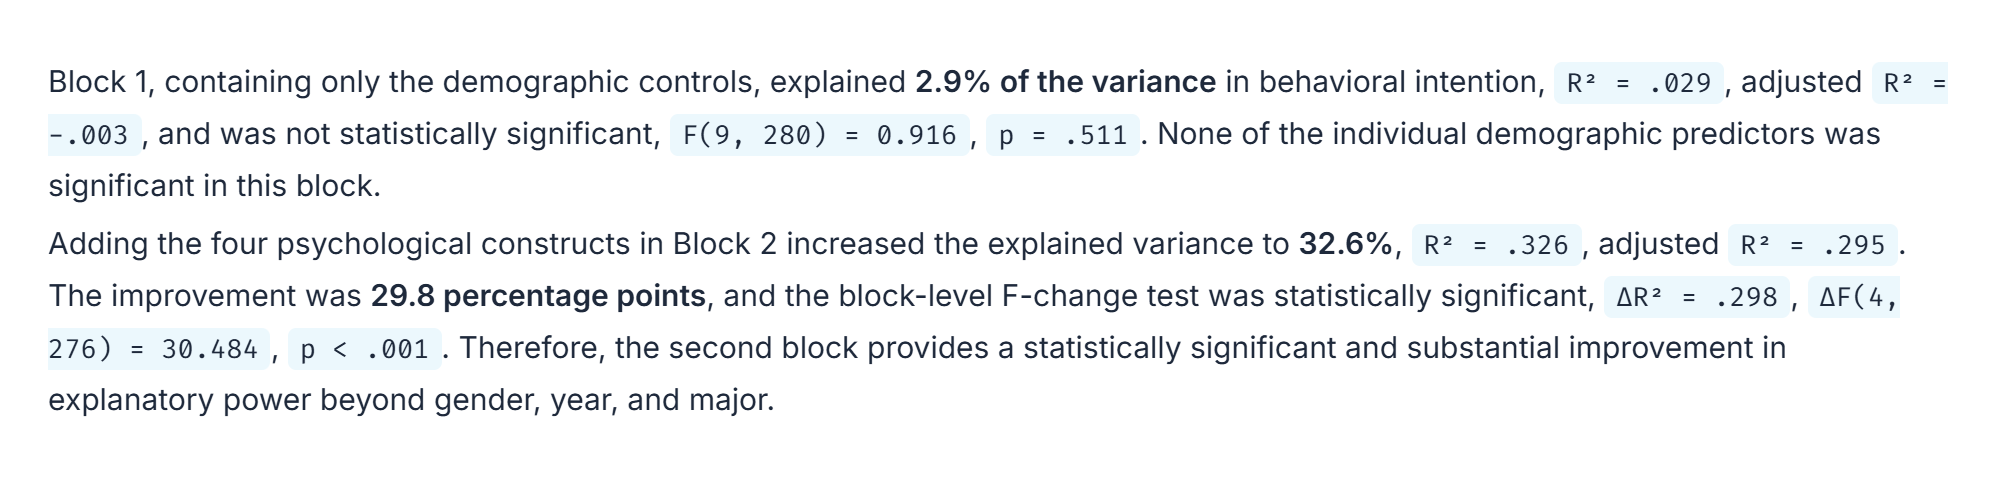 Both blocks written out against each other — read apart, the 32.6% looks like the result rather than the second half of a comparison.
Which Predictors Carry the Block, and Which Two Don't
"In the full model, perceived usefulness was a significant positive predictor of behavioral intention, B = 0.351, β = .302, p < .001. Attitude was also a significant positive predictor, B = 0.361, β = .334, p < .001, and had the largest standardized coefficient among the four added constructs. Perceived ease of use, β = .028, p = .594, and social influence, β = -.063, p = .217, were not significant after controlling for the other variables."
| Added construct | β | p | Verdict in the full model |
|---|---|---|---|
| Attitude (ATT) | .334 | < .001 | Significant positive predictor; largest standardized coefficient of the four |
| Perceived usefulness (PU) | .302 | < .001 | Significant positive predictor |
| Perceived ease of use (PEOU) | .028 | .594 | Not significant after controlling for the other variables |
| Social influence (SI) | -.063 | .217 | Not significant after controlling for the other variables |
Source: ChatSRS hierarchical regression write-up on simulated survey data, N = 290 (demo data, not real thesis data). B = 0.351 for PU and B = 0.361 for ATT are reported in the same paragraph.
Two of the four constructs did the work. The other two came along for the ride — and one of them, social influence, carries a negative sign while being nowhere near significant.
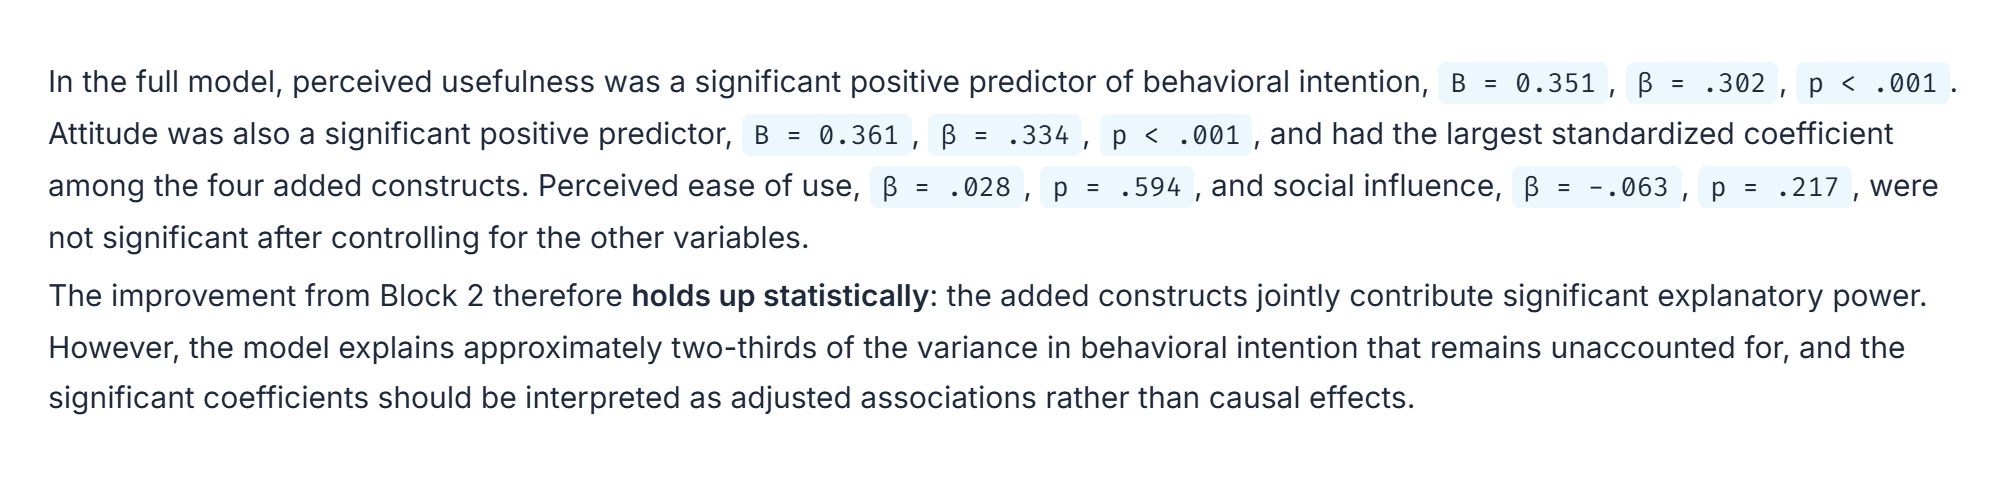 All four constructs in one frame. Cropping to the two significant ones would publish exactly the selective reading the paragraph warns against.
Why a Coefficient Can Flip Sign or Vanish
One caution the output supplied itself, and it applies to every coefficient above: the significant ones "should be interpreted as adjusted associations rather than causal effects."
Adjusted means after the controls and the other constructs are held constant — which is also why a predictor can look strong alone and vanish in the full model. A regression coefficient is not a property of the predictor; it is a property of the predictor in that equation. Change the other terms and the number changes with it.
That is the mechanism behind three things people misread as errors:
- A predictor with a healthy simple relationship to the outcome landing near zero once a correlated neighbour is included.
- A coefficient carrying the opposite sign to the one expected, as social influence does here at β = -.063 — which, at p = .217, is a sign on a coefficient that is not distinguishable from zero, and should not be interpreted as a negative effect.
- A block that explains nothing on its own, like the demographic block here, still being worth reporting.
Whether a sign change in your own model is genuine suppression is a question about your zero-order correlations, and this run did not print any — so nothing on this page establishes a suppression effect. What it does establish is the reading discipline: check the coefficient's p-value before interpreting its sign, and check the simple relationship before calling a change in it meaningful. Check the AI's reasoning yourself before any of this becomes a sentence in your thesis.
How to Read the Table, Bottom-Up
Read a two-block table from the bottom. ΔR² says how much the second block added, ΔF says whether that addition is more than noise, and only then do the individual betas mean anything.
A negative adjusted R² in block 1, -.003, is not an error — it is what the adjusted figure does when a model explains less than its parameter count would buy by chance.
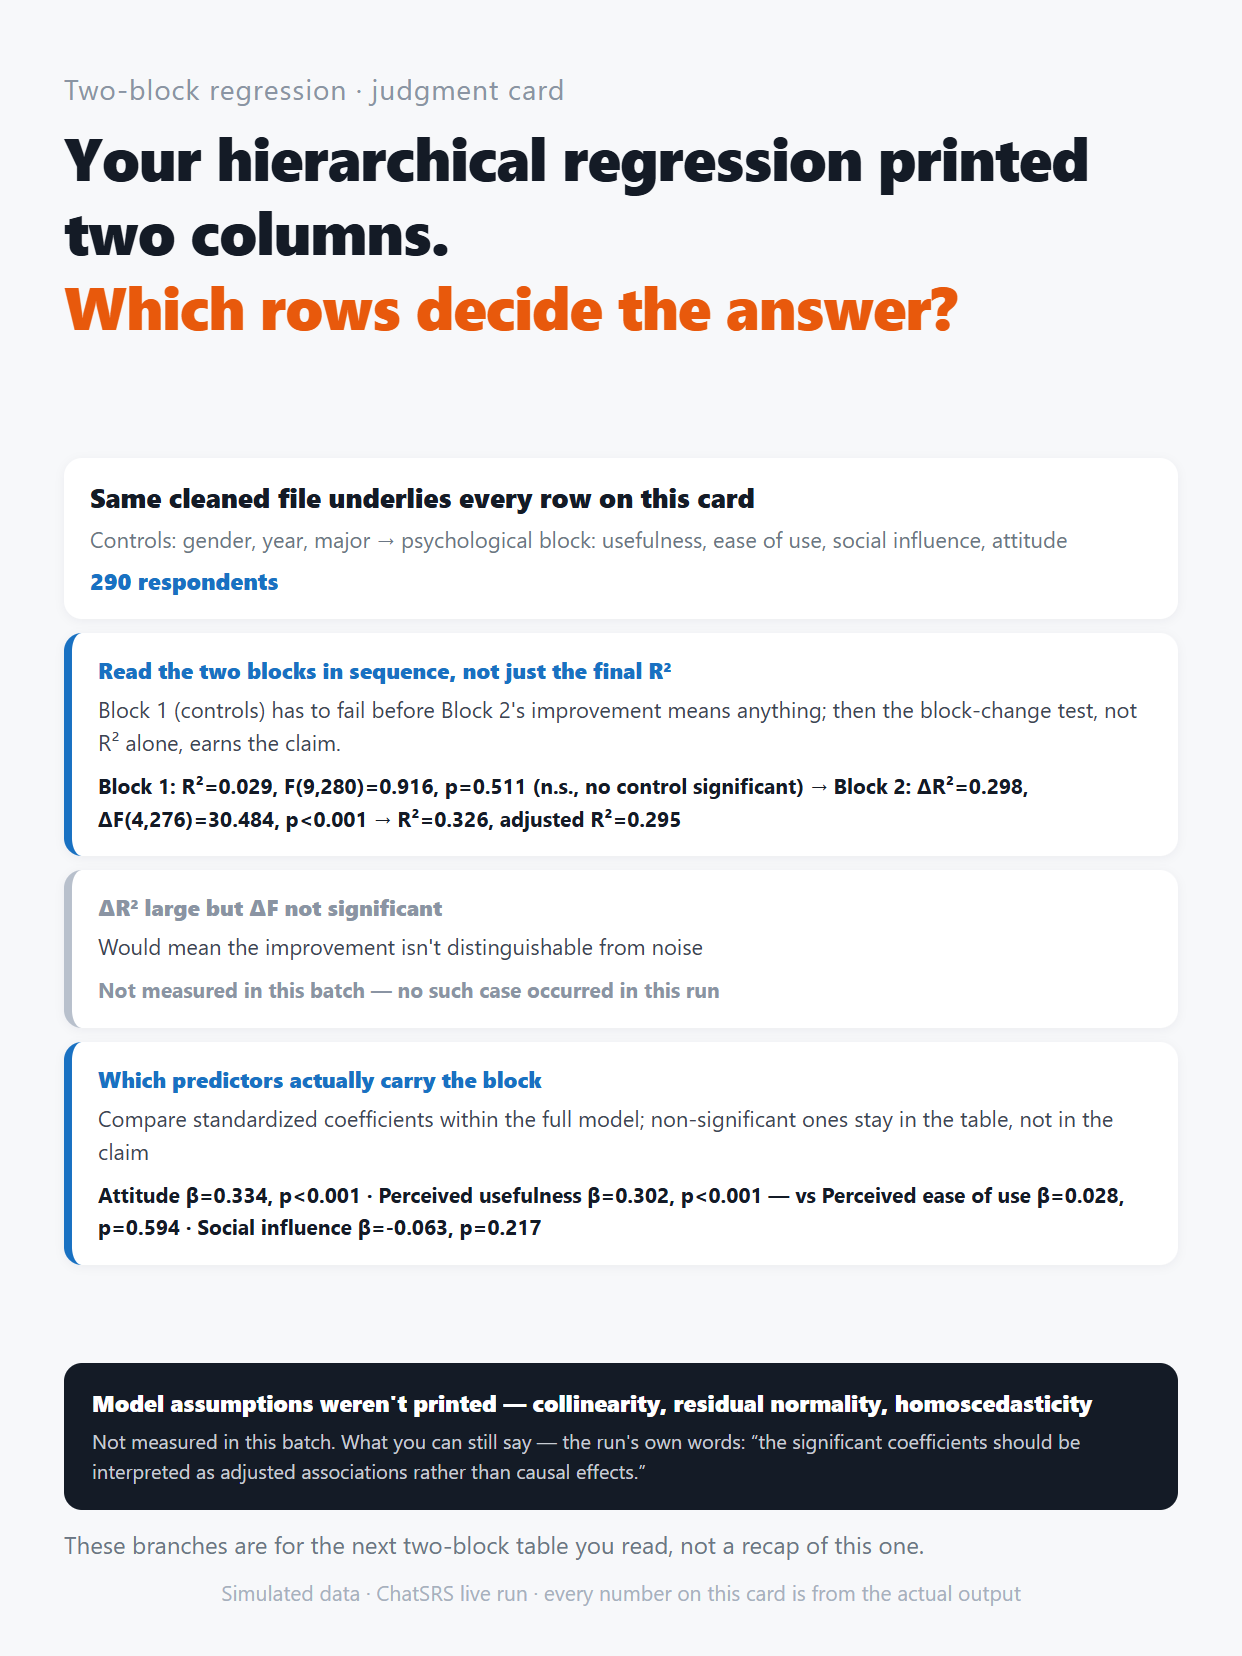 A judgment card for your own table — the four questions in order, including the assumption checks this run did not print.
What This Guide Doesn't Cover
- Setting the model up: block order, dummy coding, and naming reference categories for categorical controls — that is walked through in hierarchical regression with categorical controls.
- Writing up a predictor that came back non-significant without either hiding it or overstating it; see how to report a non-significant predictor.
- APA 7 formatting for a regression table and its accompanying paragraph; that is covered in reporting regression results in APA 7.
- Collinearity statistics, VIF, tolerance, and residual diagnostics. None is printed in this output, so none is reported or inferred here.
Frequently Asked Questions
Why did a predictor's coefficient go negative once I added the other variables?
Because a regression coefficient is conditional on the rest of the equation. It estimates the association with the outcome after the other predictors are held constant, which is why the output's own wording for the significant ones is that they "should be interpreted as adjusted associations rather than causal effects."
Can I interpret a negative coefficient that isn't significant?
Not as a negative effect. Social influence here reads β = -.063, p = .217 — a sign on an estimate that is not distinguishable from zero. Report it as non-significant and leave the direction out of the claim.
Which rows of a hierarchical regression table should I report?
ΔR² and ΔF, then the block-level fit, then the coefficients. In this run: ΔR² = .298 and ΔF(4, 276) = 30.484, p < .001, taking the model from R² = .029 to R² = .326.
Is a block that explains almost nothing worth reporting?
Yes. Block 1 here came in at R² = .029, adjusted R² = -.003, F(9, 280) = 0.916, p = .511, with no individual demographic predictor significant. That is the baseline the second block is measured against, and dropping it removes the comparison the model exists to make.
Does a large ΔR² mean the added constructs cause the outcome?
No. The output flagged the limit itself: these are adjusted associations, not causal effects. Cross-sectional survey data cannot establish direction of cause however large the change in R².
Bottom Line
A two-block regression is a comparison, not a single number. Read the change rows first, treat every coefficient as conditional on the rest of the equation, and check a coefficient's p-value before reading anything into its sign — a negative β at p = .217 is not a negative finding.
Read your own regression output in ChatSRS — get the change rows, the coefficient verdicts, and the limits stated in wording you can adapt for a results section.