Academic Reporting ·
Two Predictors Non-Significant in Your Regression? Here's What to Report
How to read and report a multiple regression table when two of your predictors come back non-significant: what the model-level test still means, how to rule out collinearity, and how to write the results sentence. Demo data, N = 300.
A non-significant predictor in a multiple regression report isn't a broken model — it means that variable showed no independent effect on the outcome once the other predictors were already in the model, and the honest move is to report it exactly that way, not adjust the data until it moves. Below is a full worked example.
What This Guide Covers
This is the results-reading companion to running multiple linear regression online — same simulated survey data (N = 300), same outcome (behavioral intention) and four predictors (perceived usefulness, perceived ease of use, social influence, attitude). That page covers running the model; this one covers what to do once two of the four rows come back above .05.
Demo data throughout — a simulated survey, N = 300, not real thesis data.
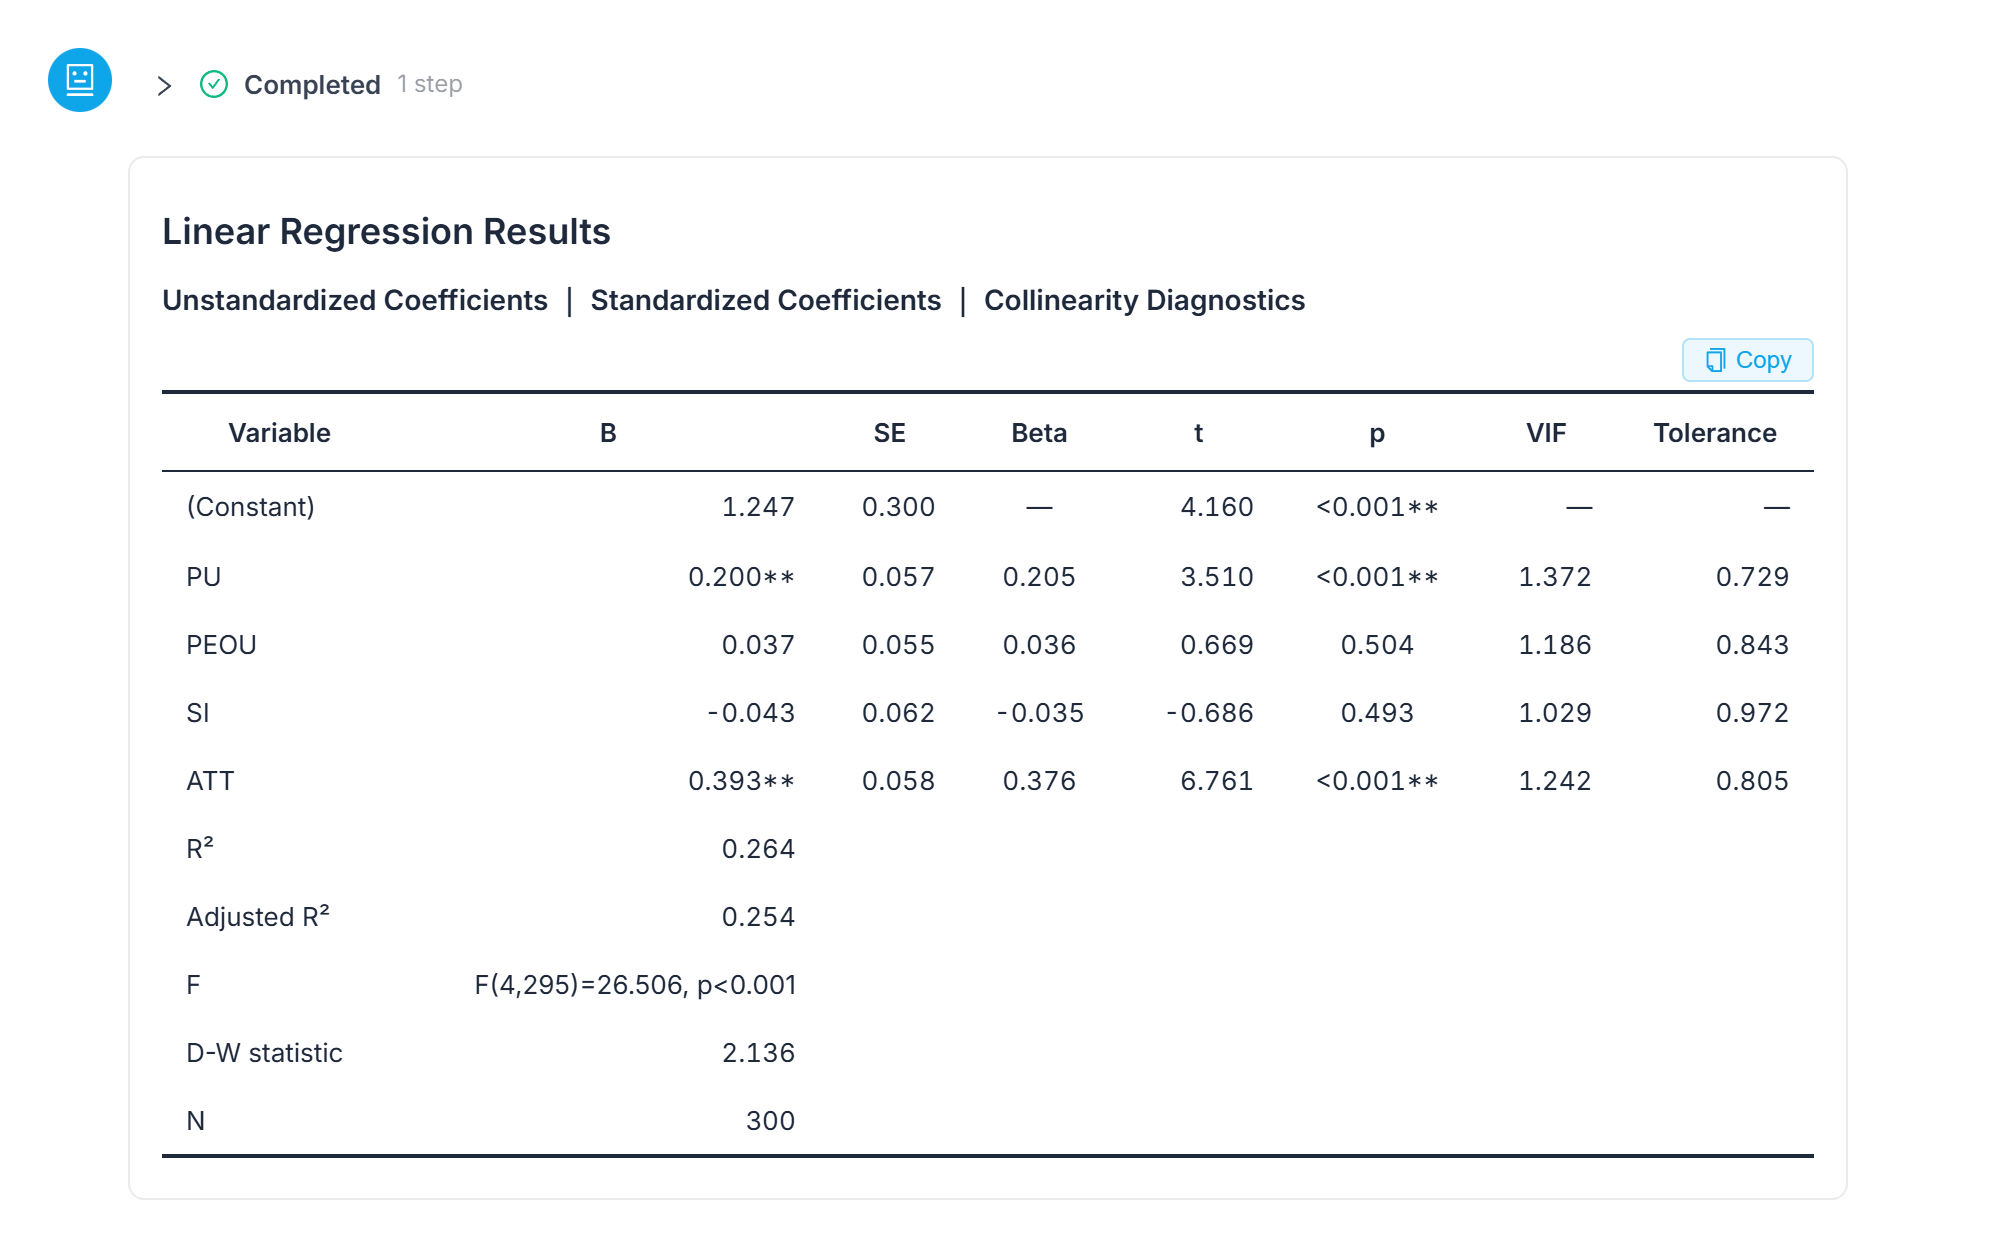 The raw output table as it came back from ChatSRS, before any reading or highlighting.
Start With the Model, Not the Rows
The model as a whole: F(4, 295) = 26.506, p < 0.001, R² = 0.264, adjusted R² = 0.254. The product's own summary was that this is "explaining 26.4% of variation in behavioral intention (adjusted R² = 25.4%)," and it checked the Durbin-Watson statistic at 2.136, noting that it "does not indicate meaningful residual autocorrelation." So the four variables together do carry real information about the outcome. That is the only thing this step established — a model can be significant while individual predictors in it are not — and that distinction is where a lot of write-ups quietly overclaim.
Read the Coefficient Rows One at a Time
| Predictor | B | Beta | t | p | Significant? |
|---|---|---|---|---|---|
| Attitude (ATT) | 0.393 | 0.376 | 6.761 | < 0.001 | Yes |
| Perceived usefulness (PU) | 0.200 | 0.205 | 3.510 | < 0.001 | Yes |
| Perceived ease of use (PEOU) | 0.037 | 0.036 | 0.669 | 0.504 | No |
| Social influence (SI) | -0.043 | -0.035 | -0.686 | 0.493 | No |
Source: ChatSRS multiple linear regression output on simulated survey data, N = 300 (demo data, not real thesis data). Model: F(4, 295) = 26.506, p < 0.001, R² = 0.264, adjusted R² = 0.254, Durbin-Watson = 2.136.
Attitude and perceived usefulness are the model. Perceived ease of use and social influence are not — but notice how carefully the product phrased that second pair: they "did not retain statistically significant independent effects in this model." Not no effect — no independent effect, once usefulness and attitude are already in. That distinction is the difference between a defensible sentence and an overreach, and it costs nothing to copy. Its closing line does the same job: attitude "was the strongest predictor of their intention to keep using it, followed by perceived usefulness," and the other two "did not show unique effects once usefulness and attitude were considered jointly."
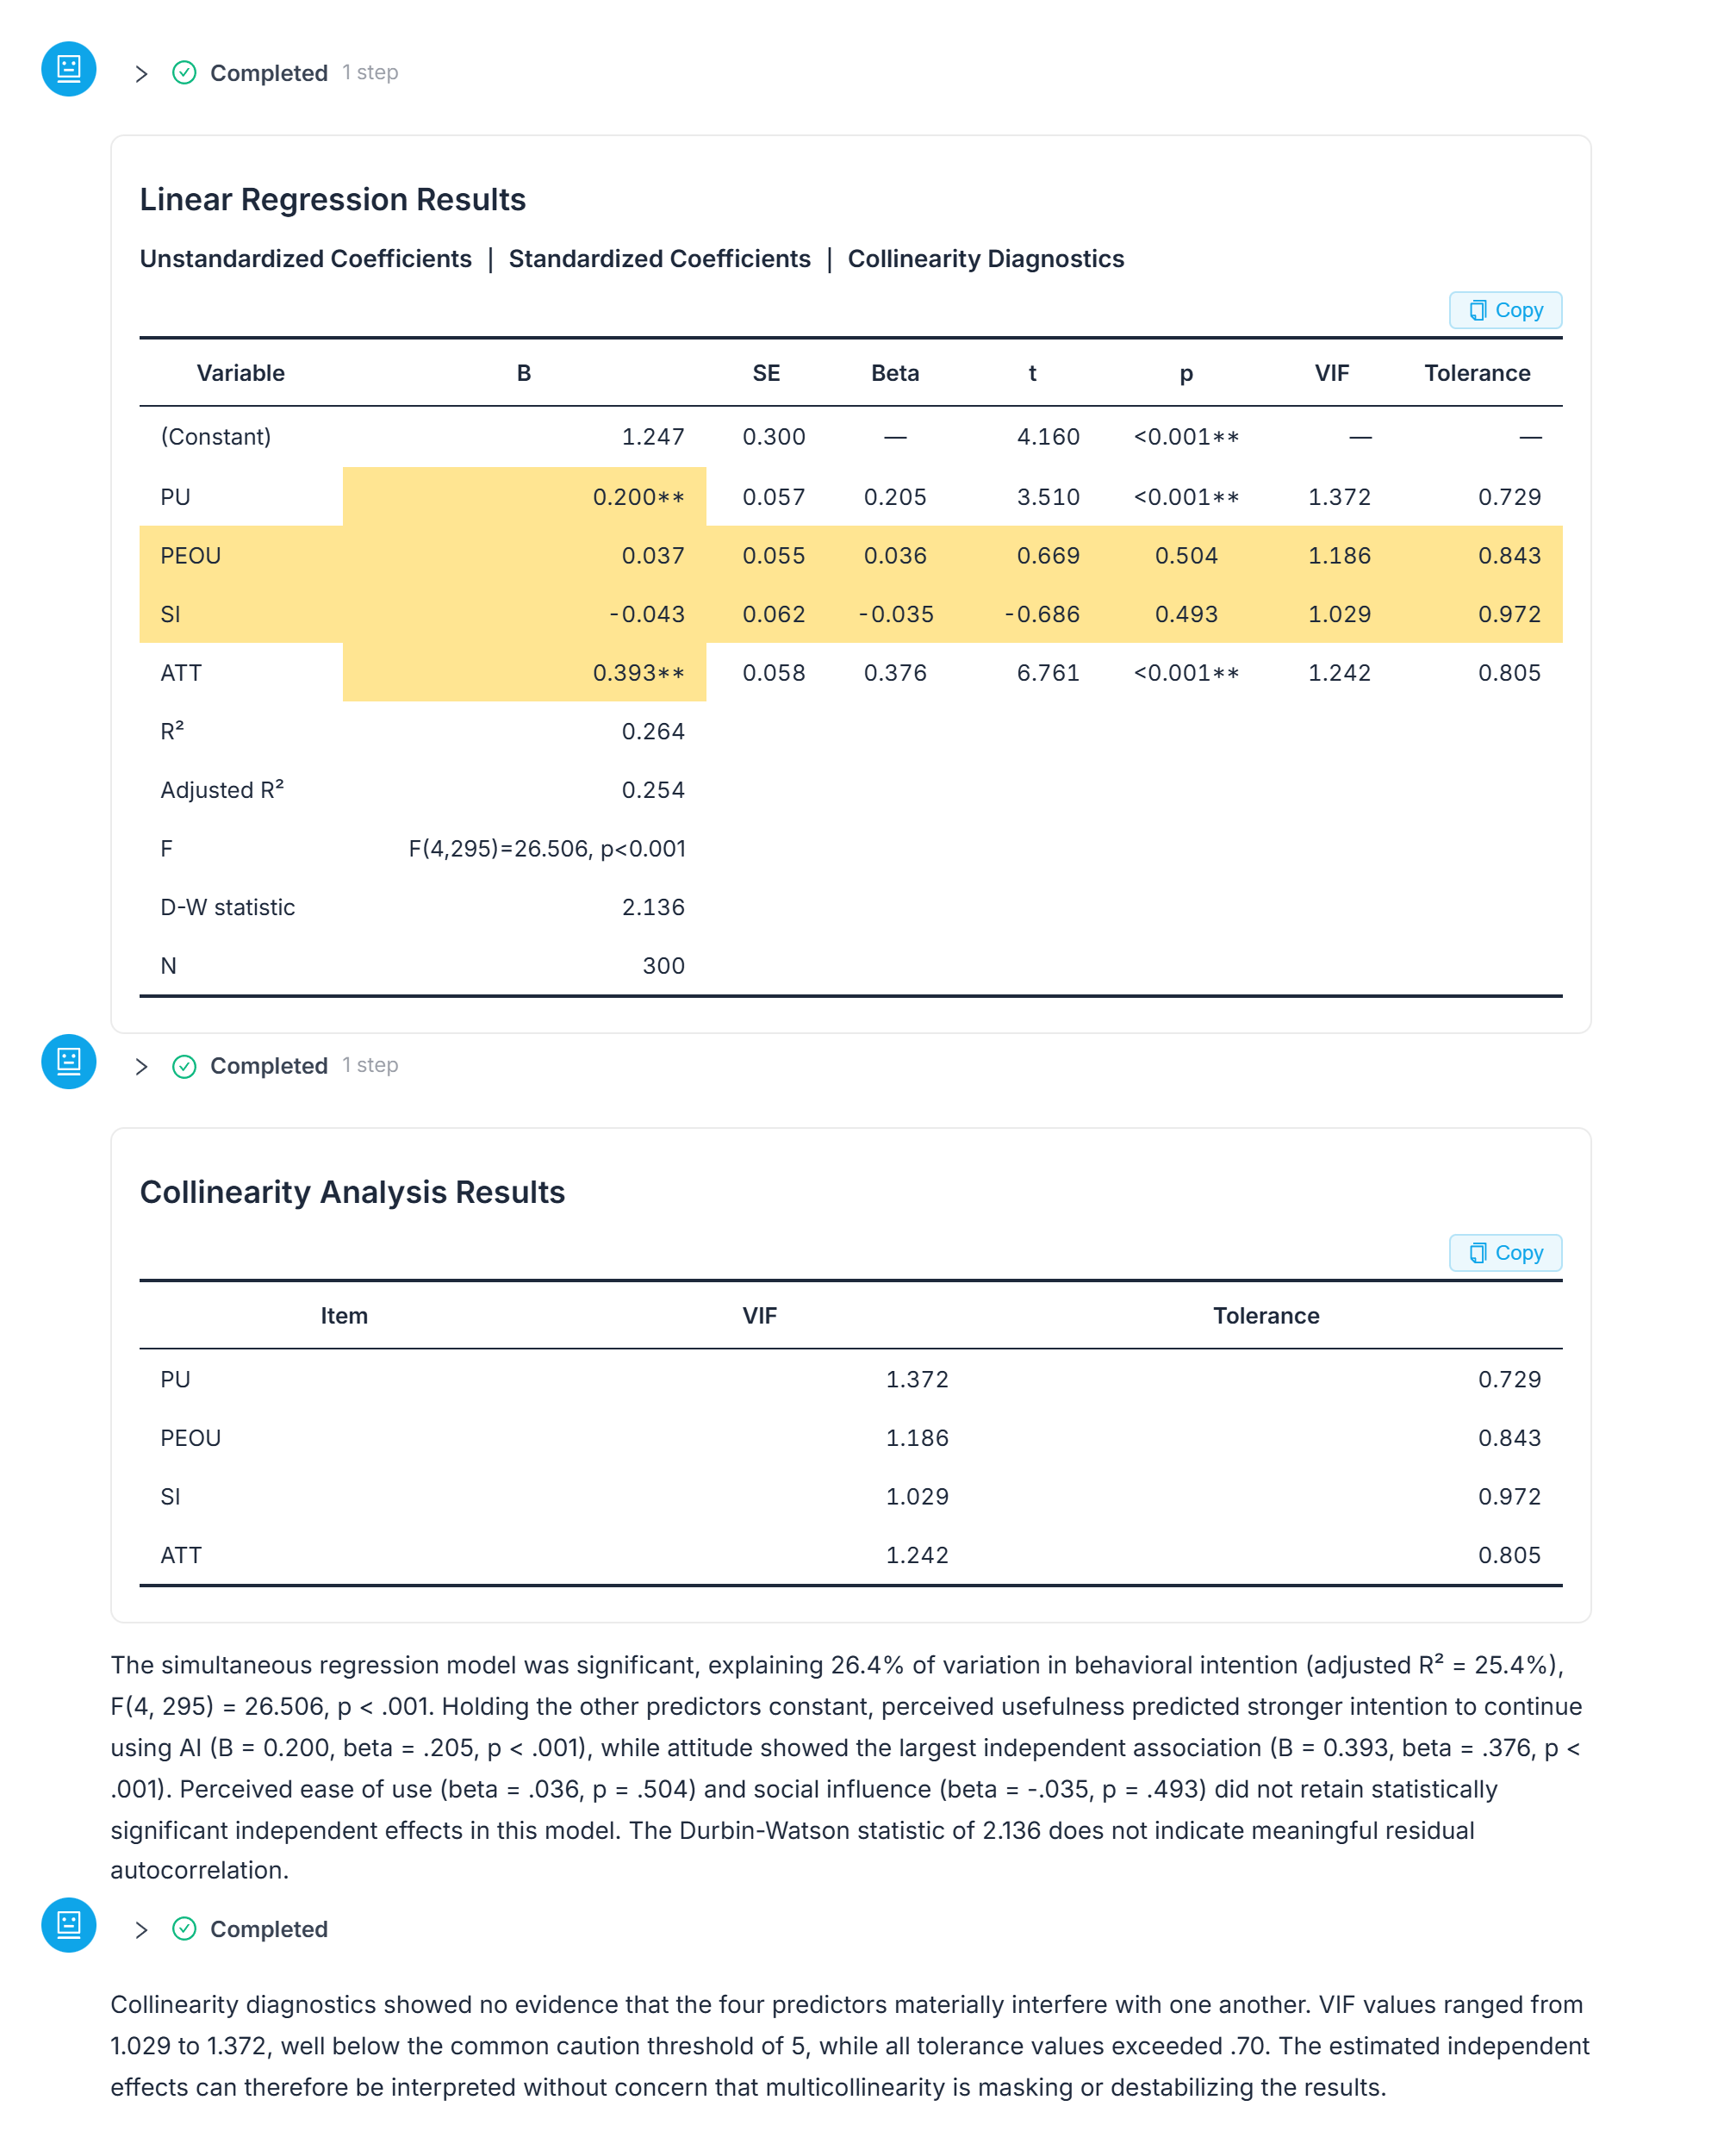 The same table, highlighted to separate the two significant rows from the two non-significant ones, alongside the collinearity table and the interpretation text.
Could Multicollinearity Be Hiding the Effect? Check This Before Anything Else
When predictors are strongly correlated with each other, the model can't separate their individual contributions, and they can end up non-significant together — multicollinearity. This table already answers that question: VIF and Tolerance are two of its own columns, and a separate diagnostic ran alongside the main regression, reporting that "VIF values ranged from 1.029 to 1.372, well below the common caution threshold of 5, while all tolerance values exceeded .70," and concluding that the estimated effects "can therefore be interpreted without concern that multicollinearity is masking or destabilizing the results." On this data, that explanation is ruled out.
Whether the flatness of perceived ease of use and social influence traces back to how those constructs were measured — rather than to how they relate to the outcome — is a separate question this page doesn't answer; the factor-analysis side of this same dataset covers it.
What Not to Do When a Predictor Isn't Significant
Dropping the handful of respondents who spoil the pattern, editing responses, or re-cutting groups and re-running until something falls under .05 are all tempting fixes. They stop being statistics problems and become academic-integrity problems — they are visible to anyone who asks for your dataset, and you will know.
How Do You Report a Non-Significant Predictor?
Non-significant predictors stay in the results table. The sentence you write about them is the careful one: no independent effect once the other predictors are accounted for. A results section that reports what did not work reads as more trustworthy, not less. If you also need to write up the model fit and coefficient block itself in full APA format — R², F, B, SE, Beta, t, p, VIF, and tolerance in the standard sequence — that's covered separately in how to report regression in APA 7.
When Does This Not Apply
This model leaves most of the variation in intention unexplained, so the four constructs here are not the whole story. Regression describes variables moving together, not one causing another. Where the .05 line sits, and whether to keep a non-significant predictor in the model at all, varies by field and by journal — that one is for your advisor. And check the AI's reasoning yourself before it becomes a paragraph in your thesis.
Frequently Asked Questions
Does a non-significant predictor mean my model is wrong or my data is bad?
No. It means that variable showed no independent effect on the outcome once the other predictors were already accounted for. The model as a whole can still be significant, as it is here (F(4, 295) = 26.506, p < 0.001).
Should I drop non-significant predictors from my results table?
No. Keep them in the table and report them precisely — "no independent effect once the other predictors are accounted for" is a defensible, honest sentence, and dropping rows selectively distorts the model.
Could multicollinearity be why two of my predictors came back non-significant?
It's worth checking before anything else. In this example, VIF values across the four predictors ranged from 1.029 to 1.372, well below the common caution threshold of 5, so multicollinearity was ruled out as the explanation here.
Is it okay to remove a few respondents to get significance?
No. Dropping inconvenient respondents, editing responses, or re-cutting groups until p falls under .05 are academic-integrity problems, not statistics techniques, and they're visible to anyone who reviews your dataset.
Bottom Line
Reading a non-significant predictor is a two-step check — is the overall model still significant, and has multicollinearity been ruled out — and reporting it is mostly writing the careful sentence, not deriving a new number.
Read your own regression output in ChatSRS — check the model fit, the VIF diagnostic, and get wording you can adapt for a non-significant predictor.