Statistical Tutorial ·
How to Run Multiple Linear Regression Online: A Full Walkthrough
A full walkthrough of running multiple linear regression online in ChatSRS: one plain-English prompt, composite scoring, model fit, coefficients, and a built-in collinearity check. Demo data, N = 300.
To run multiple linear regression online without building the model by hand, upload your data and describe the outcome and predictors in one plain-English sentence — ChatSRS creates the composite scores, fits the model, and returns coefficients, model fit, and a collinearity check in one pass. Below is a full walkthrough on demo data (N = 300).
What This Walkthrough Covers
Multiple regression is the step in a survey-based thesis where the vocabulary starts to matter: which variable is the outcome, how many predictors go in, and whether the ones you picked are stepping on each other. None of that is hard once you've done it — but the first time through, most of the evening goes on matching your research question to the right menus.
This is a walkthrough on demo data — not real thesis data. A simulated survey, N = 300, five constructs (perceived usefulness, perceived ease of use, social influence, attitude, and behavioral intention), four items each.
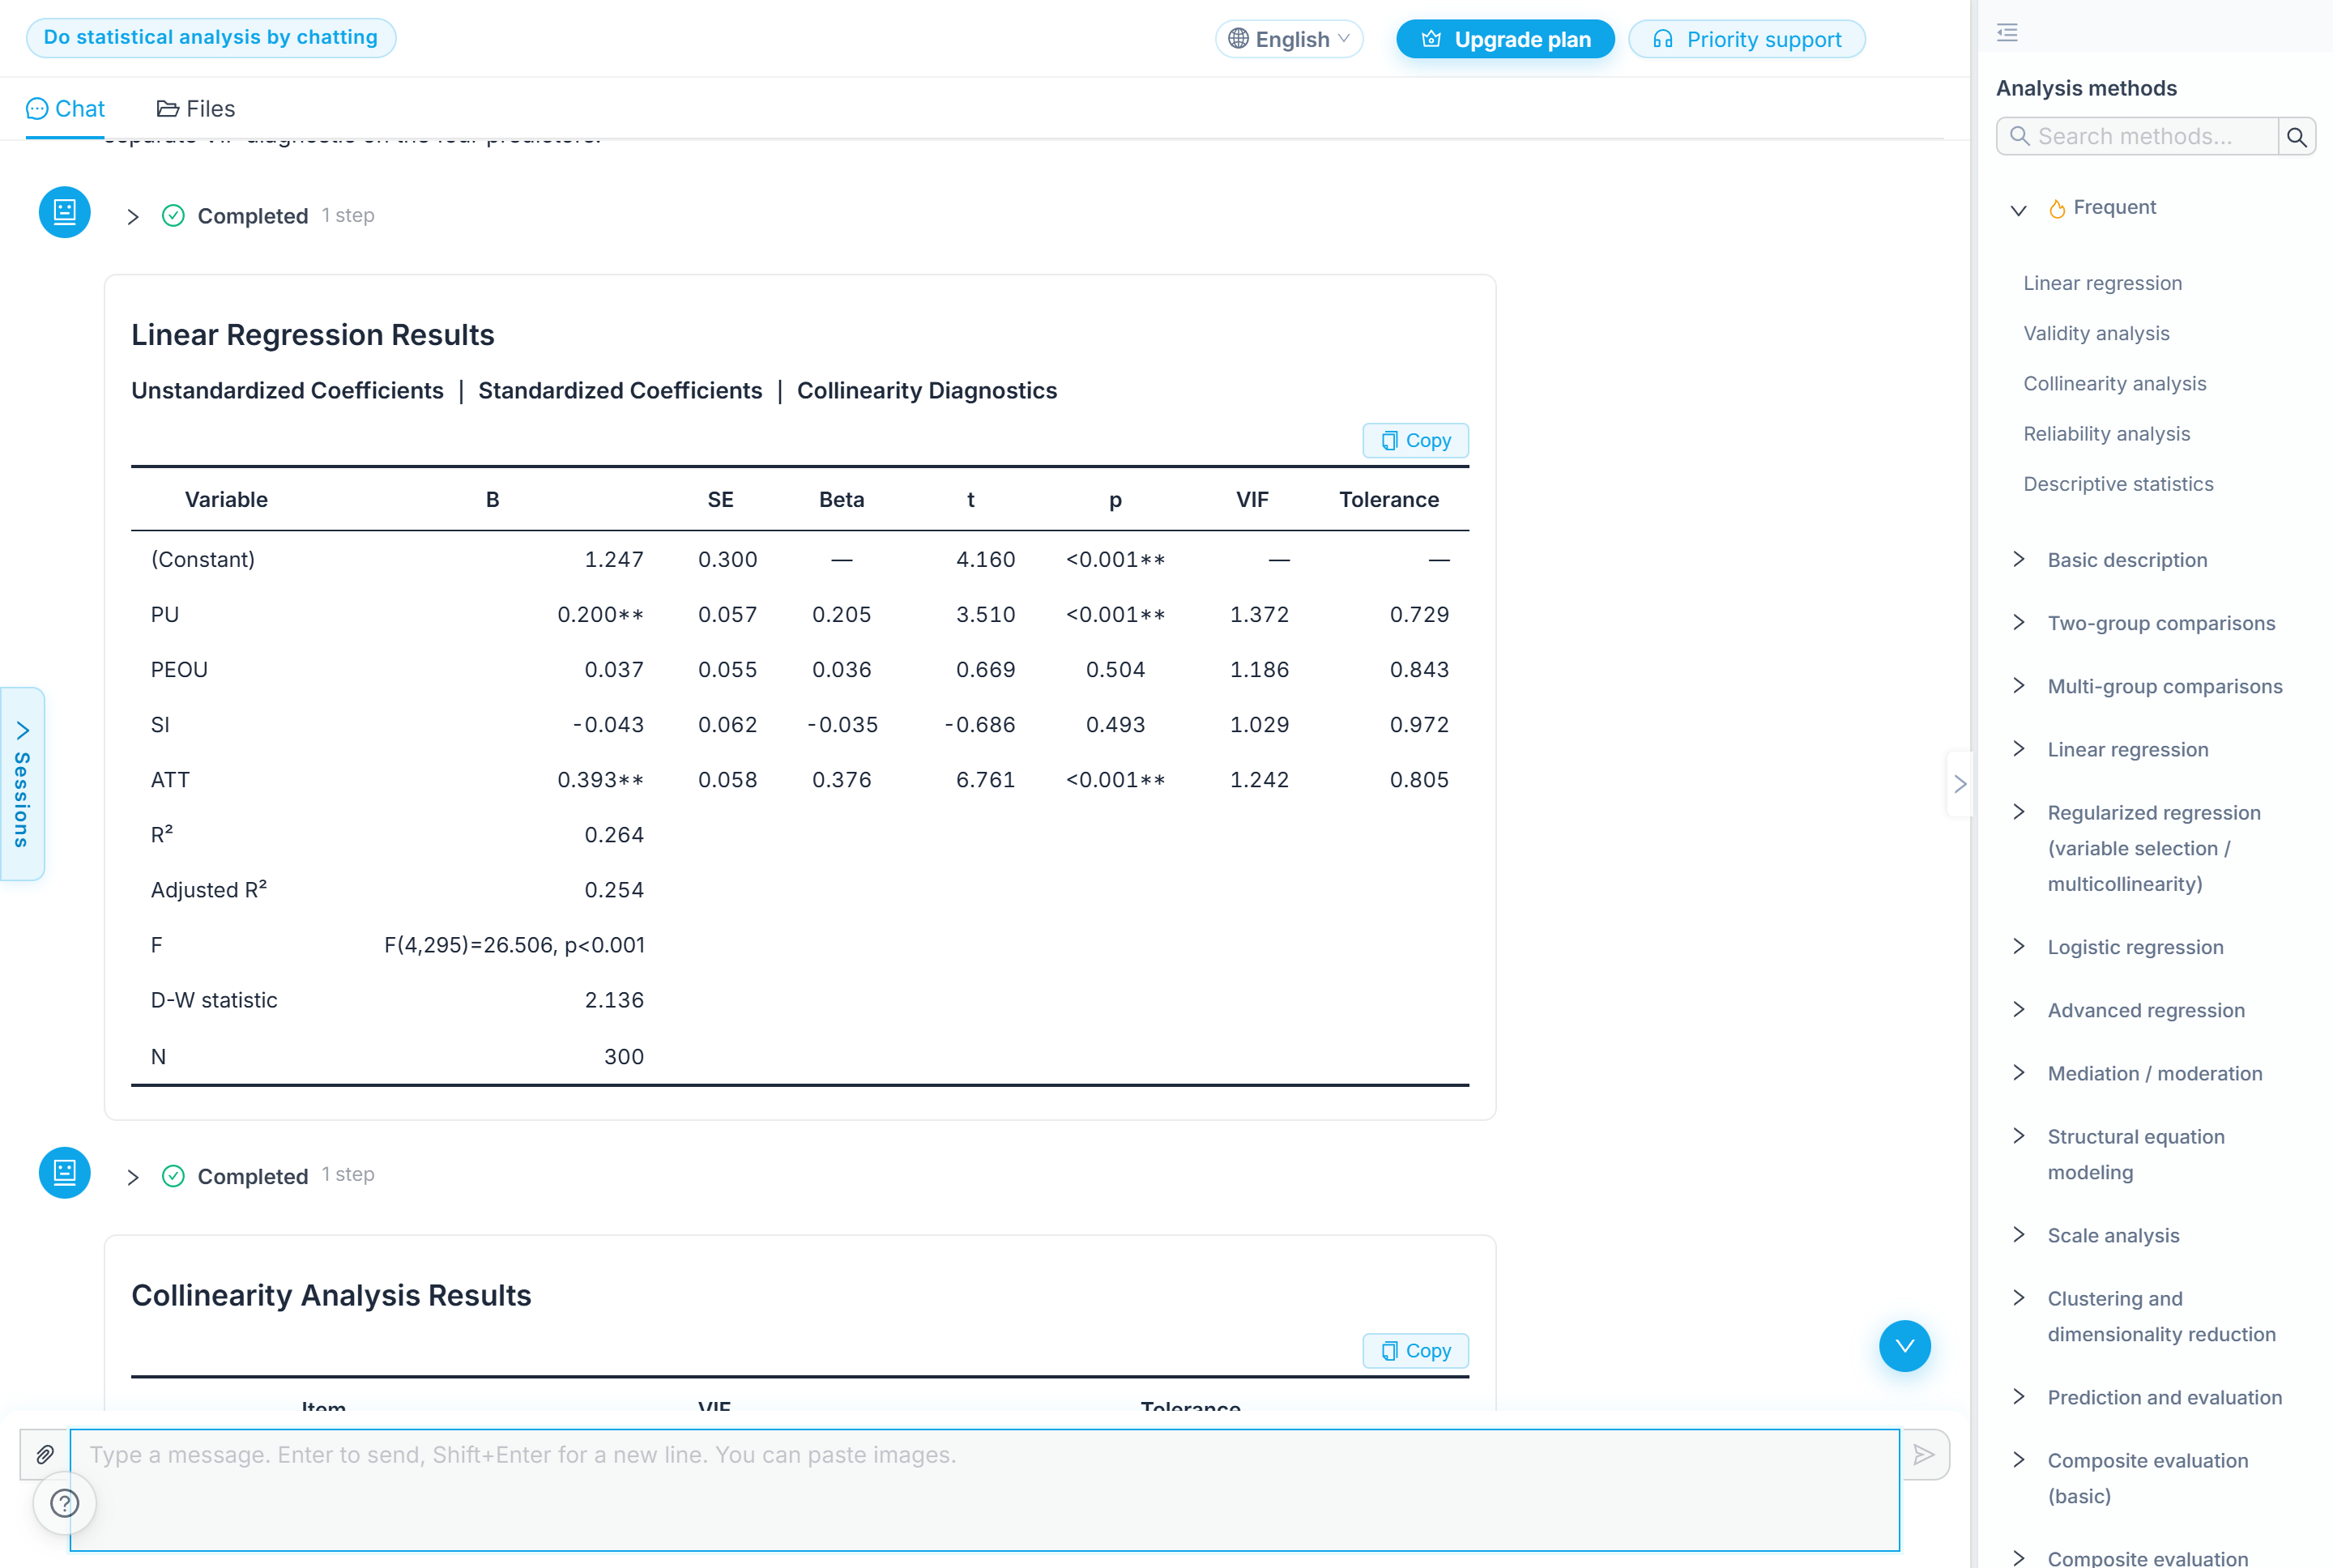 The ChatSRS interface this walkthrough was run in — the regression table appears mid-page, with the available analysis methods listed on the right.
How to Run Multiple Linear Regression Online: One Prompt, No Manual Setup
The whole thing is a conversation. I uploaded the spreadsheet and typed one line: "Same survey data — can you run a multiple linear regression for me? I want to see which of these four actually affects whether students keep using AI tools: perceived usefulness, perceived ease of use, social influence, and attitude. Tell me how big each one's effect is and which ones hold up. Also check whether those four interfere with each other." Three things had to be in there and nothing else did: which file, which thing I wanted explained, and which things might explain it.
It filled in the rest. I never mentioned averaging the four items of each construct into a score, and that was the first thing it said it would do: "I will model behavioral intention as the outcome and enter the four scale constructs simultaneously." Then, before running anything: "The analysis uses composite scores: each construct is the mean of its four questionnaire items, and behavioral intention is the mean of the four future-use items. I will now create this analysis-only scoring file, then run the simultaneous regression and a separate VIF diagnostic on the four predictors." That phrase analysis-only matters — it built the scored copy as a separate file rather than writing over what I uploaded.
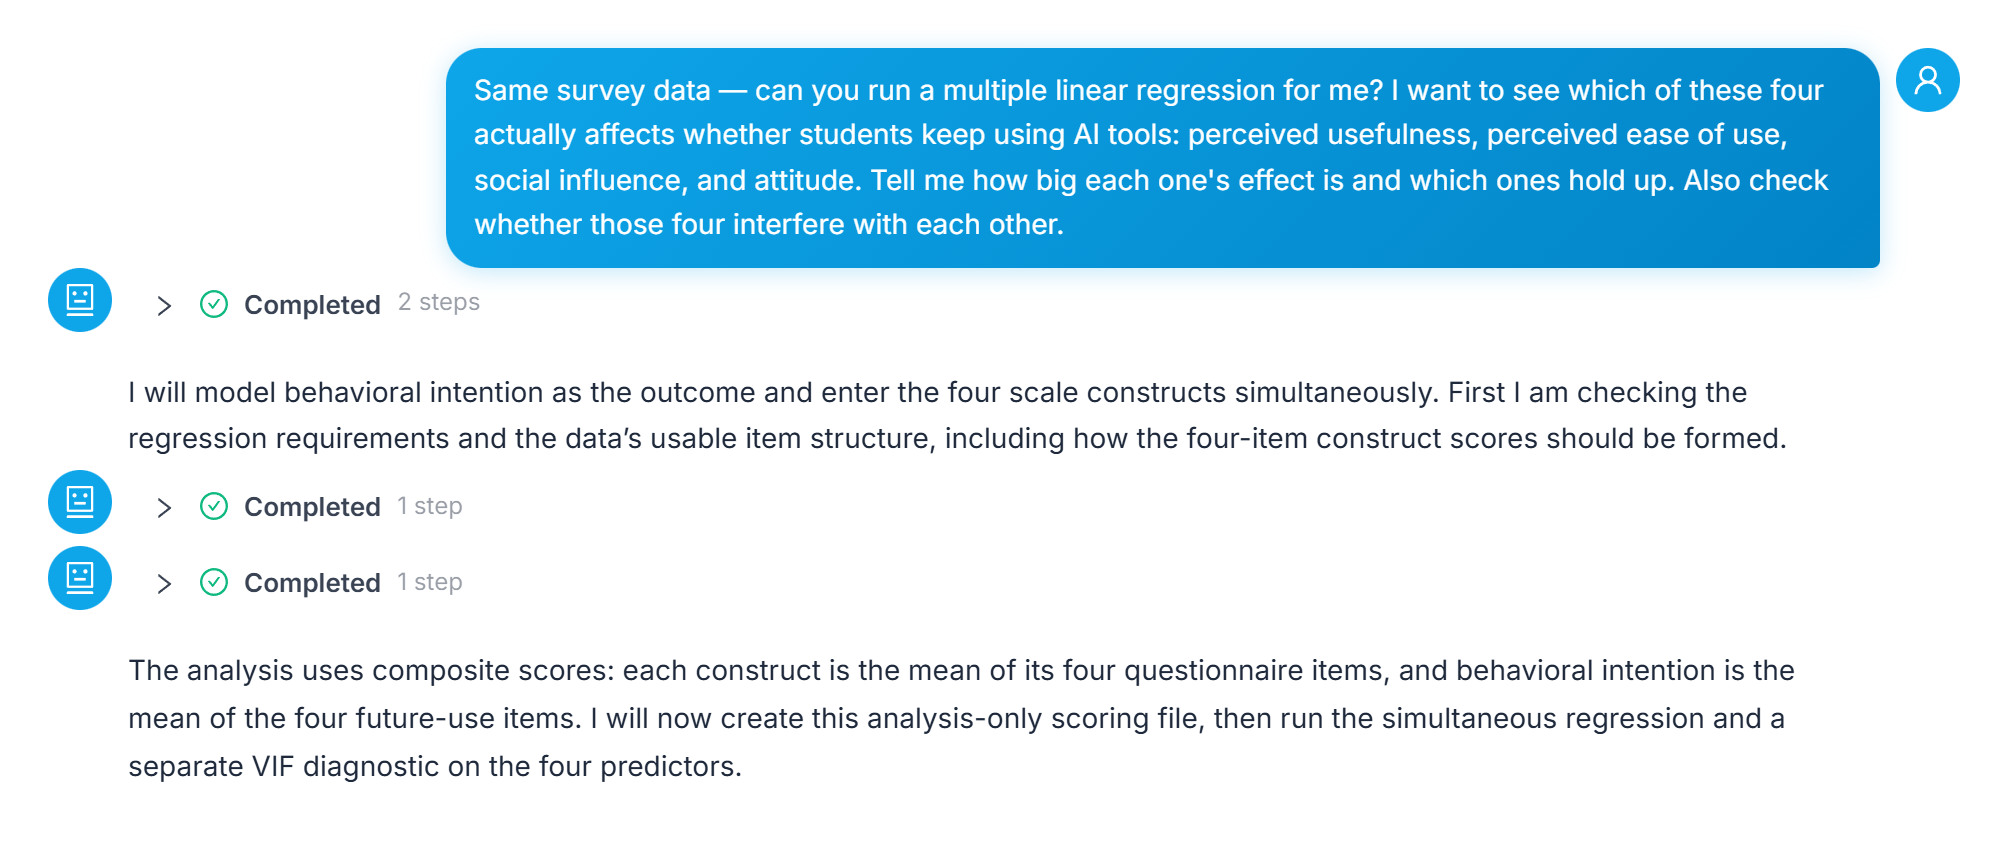 The one-line prompt that started the analysis, and the assistant's reply explaining the composite-scoring step before it fit anything.
Reading the Output: Model Fit, Coefficients, and the Collinearity Check
Most of the cells a results section asks for come back on one table: the model as a whole at F(4, 295) = 26.506, p < 0.001, with R² = 0.264 and adjusted R² = 0.254; one row per predictor carrying B, Beta, t, and p; and Durbin-Watson = 2.136 and N = 300 along the bottom.
| Predictor | B | Beta | t | p | Significant? |
|---|---|---|---|---|---|
| Attitude (ATT) | 0.393 | 0.376 | 6.761 | < 0.001 | Yes |
| Perceived usefulness (PU) | 0.200 | 0.205 | 3.510 | < 0.001 | Yes |
| Perceived ease of use (PEOU) | 0.037 | 0.036 | 0.669 | 0.504 | No |
| Social influence (SI) | -0.043 | -0.035 | -0.686 | 0.493 | No |
Source: ChatSRS multiple linear regression output on simulated survey data, N = 300 (demo data, not real thesis data). Model: F(4, 295) = 26.506, p < 0.001, R² = 0.264, adjusted R² = 0.254, Durbin-Watson = 2.136.
Two of the four predictors — perceived ease of use and social influence — did not reach significance here. That is not an error in the model; what to do with a non-significant predictor, and how to write that paragraph, is the whole subject of reading and reporting a non-significant predictor, on this same table.
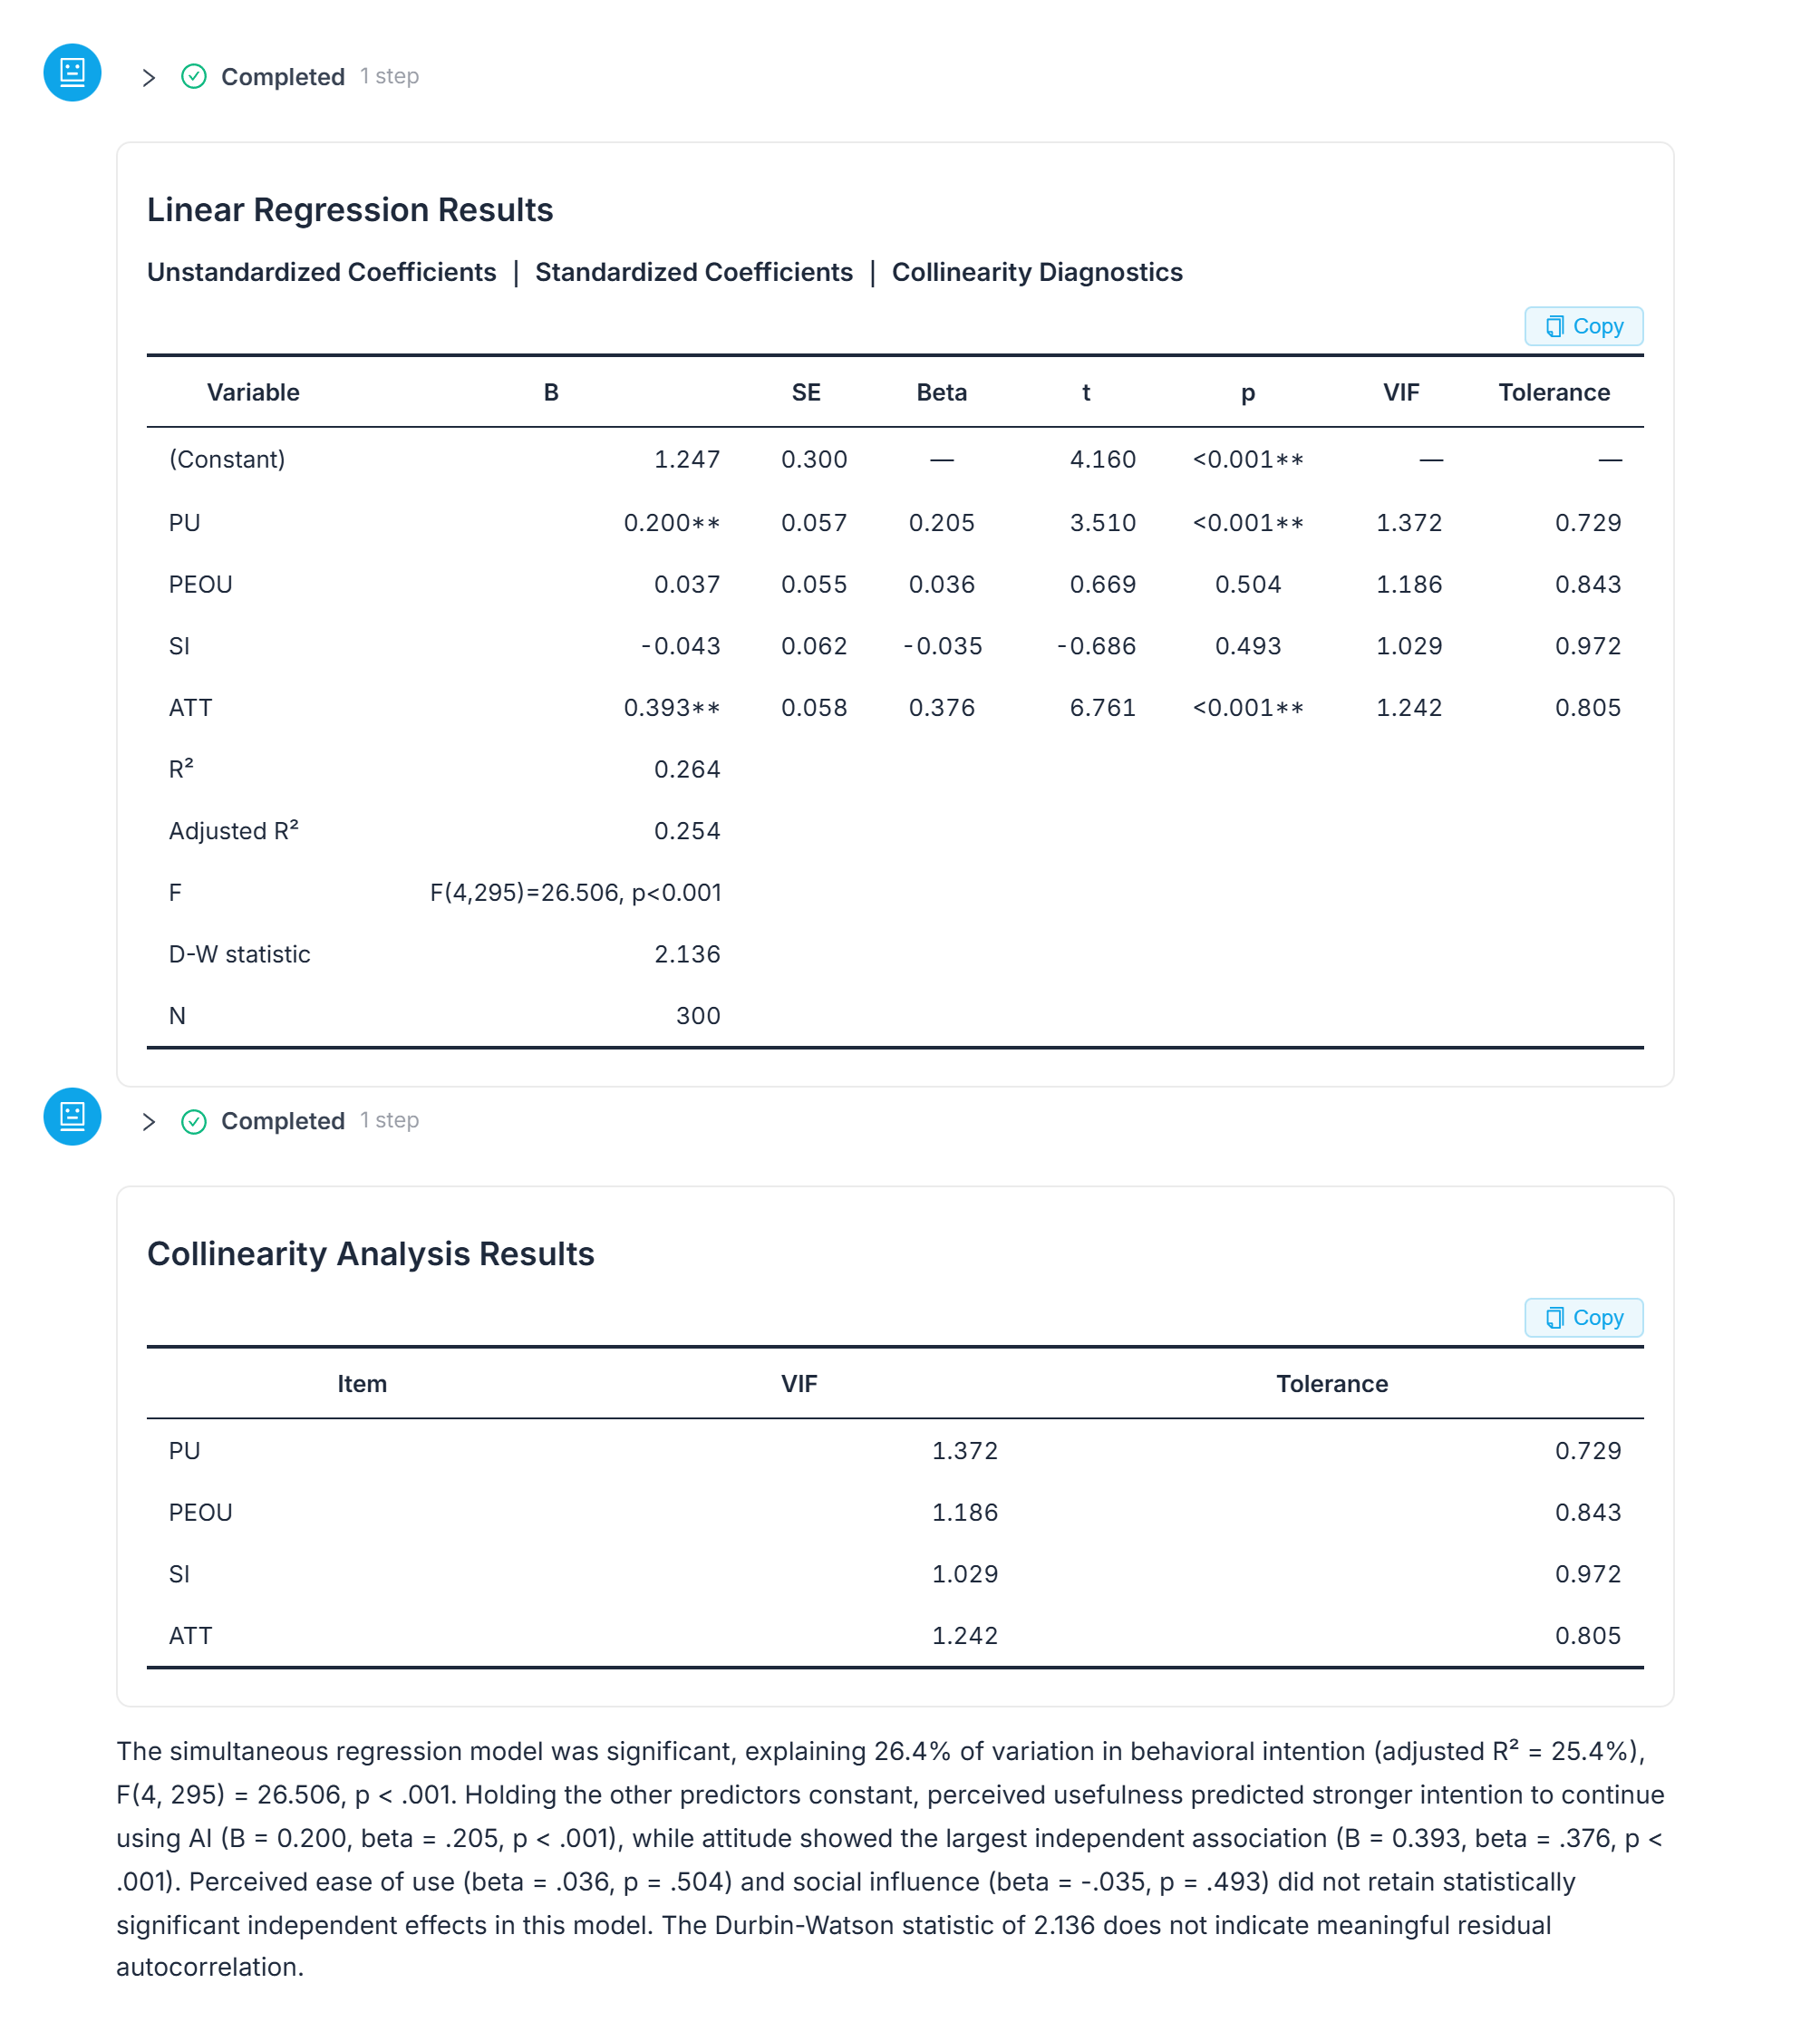 The full regression table with VIF and Tolerance on the right, alongside the separate collinearity diagnostic and the model's own interpretation text.
How High Is Too High? Reading the Collinearity (VIF) Check
The collinearity columns are not a second job — VIF and Tolerance sit in the same table, and a separate diagnostic ran alongside the main regression. Multicollinearity means the predictors are correlated enough with each other that the model can't cleanly separate their individual effects, which can make coefficients and p values unstable.
In this run, VIF values across the four predictors run from 1.029 to 1.372, well under the threshold of 5 that usually starts a conversation about dropping or combining predictors. That is a check worth running before you interpret any single coefficient — a high VIF can be the actual reason a predictor looks non-significant, and this table rules that explanation out here.
A limit worth stating: this model explains 26.4% of the variation in intention, which leaves most of it outside these four variables. Regression describes variables moving together; which one causes which is a question your research design answers, not your output. Check the AI's reasoning yourself before you build on it.
What This Walkthrough Doesn't Cover
- Judging which coefficients are meaningful and writing the results paragraph — that's a separate discussion, covered in how to report a non-significant predictor.
- Testing whether one construct explains the relationship between two others, rather than predicting an outcome directly from several predictors at once, is a mediation question; see running a mediation analysis without PROCESS.
- Confirming that each construct's items belong together before you average them into a score is a reliability question; see how to run, interpret, and report Cronbach's alpha.
- With cross-sectional demo data like this, the output can support an association but cannot by itself establish which variable causes which.
Frequently Asked Questions
Do I need to average my questionnaire items into scores myself before running this?
No. In this walkthrough, ChatSRS built the composite scores automatically — each construct as the mean of its four items — and saved them to a separate analysis-only file rather than overwriting the uploaded data.
Does naming the method matter, or can I just describe what I want in plain English?
Both worked together here. The prompt named the method ("multiple linear regression") and then described the outcome and the four predictors in ordinary words — naming which file, what to explain, and what might explain it was what mattered, not statistical phrasing.
Does this check for multicollinearity automatically, or do I have to ask for it separately?
In this run it ran automatically alongside the main regression: VIF and Tolerance appear as columns in the coefficient table, and a separate collinearity diagnostic table came back with the same request.
What if one of my predictors doesn't turn out significant?
That's not a broken model — it's a normal result, and it's the subject of the next page: reading and reporting a non-significant predictor.
Bottom Line
Multiple regression doesn't require memorizing menu paths or manually averaging items into scores. Naming the outcome and predictors in one plain-English sentence, and reading the coefficient, model-fit, and collinearity numbers back from one table, is the same underlying test, run a different way.
Run your own multiple regression in ChatSRS — bring your outcome and predictor variables; composite scoring and the collinearity check come back in the same pass.