Academic Reporting ·
How to Report Descriptive Statistics in APA 7: Mean, Median, and the Skew That Explains the Gap
How to read a descriptive statistics table and decide which figure belongs in your results section: what it means when the mean and median disagree this much, why the standard deviation can be larger than the mean, and how to write that sentence. Demo data, N = 290.
When the mean and median of the same variable disagree this much, the honest results sentence reports both, states which one describes a typical respondent, and names the skew that explains the gap — not one number picked because it looks tidier. Below is a full worked example.
What This Guide Covers
This is the results-reading companion to running descriptive statistics online — same simulated survey, same cleaned sample. That page covers the data-quality check that got the sample down to 290 respondents; this one covers what to do once two of the numbers in the descriptives table don't agree.
Demo data throughout — a simulated survey, cleaned down to 290 respondents, not real thesis data. The Descriptive Statistics Results table covers five constructs plus weekly AI-tool-use hours.
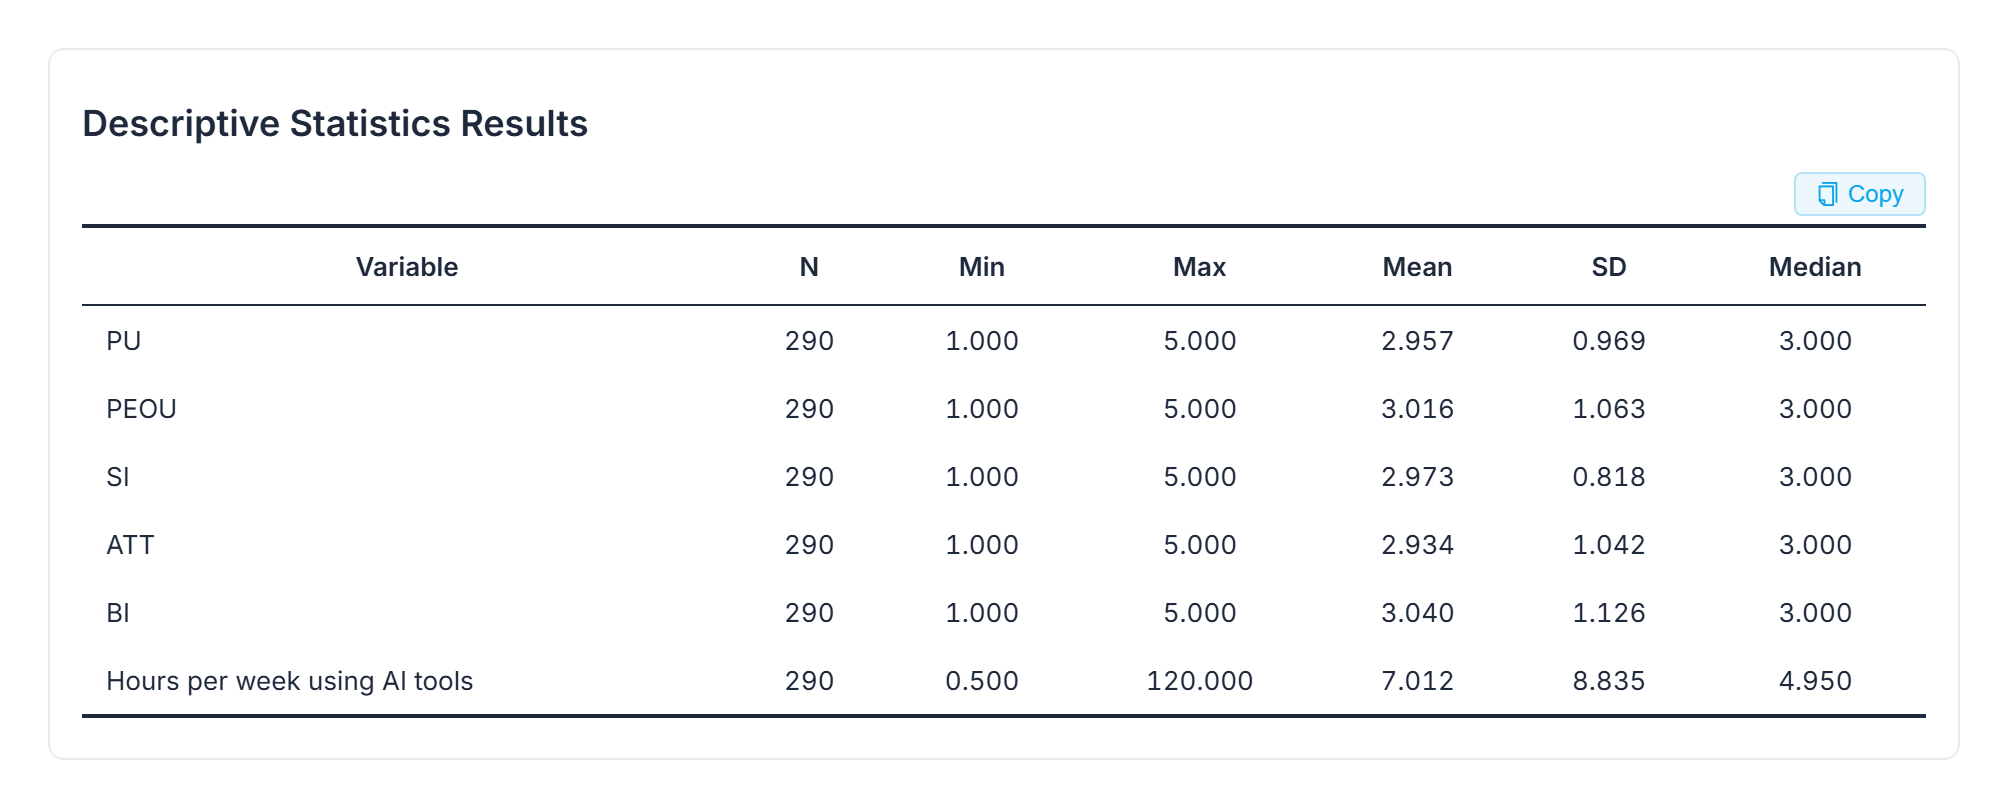 The full descriptives table exactly as it came out, before any of the six rows get read closely.
Five Rows That Barely Disagree
On five of the six rows, mean and median barely disagree.
| Variable | N | Min | Max | Mean | SD | Median |
|---|---|---|---|---|---|---|
| Perceived usefulness (PU) | 290 | 1.000 | 5.000 | 2.957 | 0.969 | 3.000 |
| Perceived ease of use (PEOU) | 290 | 1.000 | 5.000 | 3.016 | 1.063 | 3.000 |
| Social influence (SI) | 290 | 1.000 | 5.000 | 2.973 | 0.818 | 3.000 |
| Attitude (ATT) | 290 | 1.000 | 5.000 | 2.934 | 1.042 | 3.000 |
| Behavioral intention (BI) | 290 | 1.000 | 5.000 | 3.040 | 1.126 | 3.000 |
| Hours per week using AI tools | 290 | 0.500 | 120.000 | 7.012 | 8.835 | 4.950 |
Source: ChatSRS descriptive statistics output on simulated survey data, N = 290 (demo data, not real thesis data).
As the product summarized the first five rows: "All five construct means are close to the neutral midpoint of 3.00. Behavioral intention has the highest mean (M = 3.040), followed closely by perceived ease of use (M = 3.016), while attitude has the lowest mean (M = 2.934). Social influence shows the smallest variability (SD = 0.818), whereas behavioral intention is the most variable construct (SD = 1.126)." Five 1–5 scale scores, five medians sitting at 3.000, five means within a tenth of a point of that. Nothing here should surprise a reader.
The Sixth Row: Hours Per Week
Then the sixth row. Hours per week using AI tools: N = 290, Min = 0.500, Max = 120.000, Mean = 7.012, SD = 8.835, Median = 4.950. The standard deviation is larger than the mean itself. The mean sits well above the median. Nothing about the five constructs prepares you for that row, and nothing about it is a data-entry mistake — it is what a bounded-below distribution stretched out toward the high end by a handful of large values, a right-skewed distribution, looks like once you calculate a mean on it.
Why ID 307 Is Still in the Sample
The reason a value that large is still in the sample at all traces back to the cleaning pass: "The cleaned analytic sample includes 290 respondents. This follows the previously agreed cleaning rule: duplicate copies were reduced to one record per submission, responses with missing answers or invalid scale values were removed, and ID 306 was excluded for the impossible 168 hours per week. ID 307, with 120 hours per week, was retained as an extreme but not mathematically impossible value." One respondent, kept at the extreme end of the distribution on purpose, is enough to drag a mean upward without moving the median much at all — the median only asks where the middle respondent sits, and the middle respondent is nowhere near 120 hours.
 The paragraph that explains why one extreme value is still pulling the mean above the median.
Which Number Goes in the Results Section?
Both, but not with equal weight. When a variable is this skewed, the median is the one that describes a typical respondent — half the sample above it, half below — while the mean is still correct arithmetically but is being pulled by a small number of extreme cases. The honest version of this sentence reports the mean and SD, because most readers expect them, states the median right next to it, because the two disagree this much, and says in one sentence why: a right-skewed distribution with a retained extreme value. That sentence is the one a lot of first drafts skip.
A caveat worth stating in the same paragraph: descriptive statistics alone do not tell you whether that skew reflects a real pattern in how students use AI tools or is being driven disproportionately by ID 307 specifically. A responsible next step is a sensitivity check — report the descriptives with and without that one respondent and see how much the mean moves — before deciding how much weight to put on it. Where exactly to draw that line is a conversation for you and your advisor, not something a descriptive table settles by itself.
What This Guide Doesn't Cover
- How the 290-person sample was built — which submissions got dropped, and why — is covered in running descriptive statistics online, on the raw 310-submission dataset this table was built from.
- Writing up a regression table in full APA format, once your predictors are defined, is covered separately in how to report regression in APA 7.
- Whether this much skew changes which significance test is appropriate for a given variable is a separate question this page doesn't answer.
Frequently Asked Questions
If the mean and median disagree, does that mean one of them is wrong?
No. Both are calculated correctly here — Mean = 7.012, Median = 4.950. The gap is a description of the distribution's shape, not an error. A right-skewed distribution produces exactly this pattern.
Should I report only the median when a variable is this skewed?
Report both, plus the standard deviation, and name the skew in one sentence. Most readers expect a mean and SD; leaving out the median when they disagree this much is the part that reads as incomplete, not the mean itself.
Why is the standard deviation larger than the mean?
Because a small number of large values (here, respondents reporting well above 100 hours per week) stretch the distribution out. SD = 8.835 against Mean = 7.012 is a signal to look at the shape of the distribution, not a calculation error.
Should I drop the extreme value (ID 307) to make the mean and median agree?
Not automatically. It was retained because it is extreme but not mathematically impossible. A sensitivity check — reporting the descriptives with and without that respondent — is the defensible way to see how much it's driving the mean, rather than removing it to make the numbers look tidier.
Bottom Line
Reporting descriptive statistics is mostly a reading exercise, not a new calculation — check whether the mean and median agree, and if they don't, say which one describes a typical respondent and why the gap exists.
Read your own descriptives table in ChatSRS — upload your data and get the mean, median, SD, and range back in the same table, ready to read closely.