Statistical Tutorial ·
How to Run Descriptive Statistics Online: A Full Walkthrough
A full walkthrough of cleaning survey responses and running descriptive statistics online in ChatSRS: one plain-English prompt for the data-quality check, the drop list it returns, and the sample table once the excluded rows are gone. Demo data, N = 290.
Before descriptive statistics mean anything, the responses have to earn their place in the sample: run a data-quality check for duplicates, straight-lined answers, missing values, out-of-range scores, and anything physically impossible, then rebuild the sample table on whatever survives. Below is a full walkthrough on demo data — one plain-English prompt, the drop list it returned, and the table that came back once the excluded rows were actually gone.
What This Walkthrough Covers
You hit send on the survey, the responses come back, and before you calculate anything, you have to answer a less glamorous question first: which of these responses can you actually keep? None of it shows up in a topline stats table, and all of it has to be resolved before that table means anything.
This is a walkthrough on demo data — not real thesis data. A simulated survey, 310 submissions, five constructs (perceived usefulness, perceived ease of use, social influence, attitude, behavioral intention) built from four items each, plus demographics and weekly AI-tool-use hours.
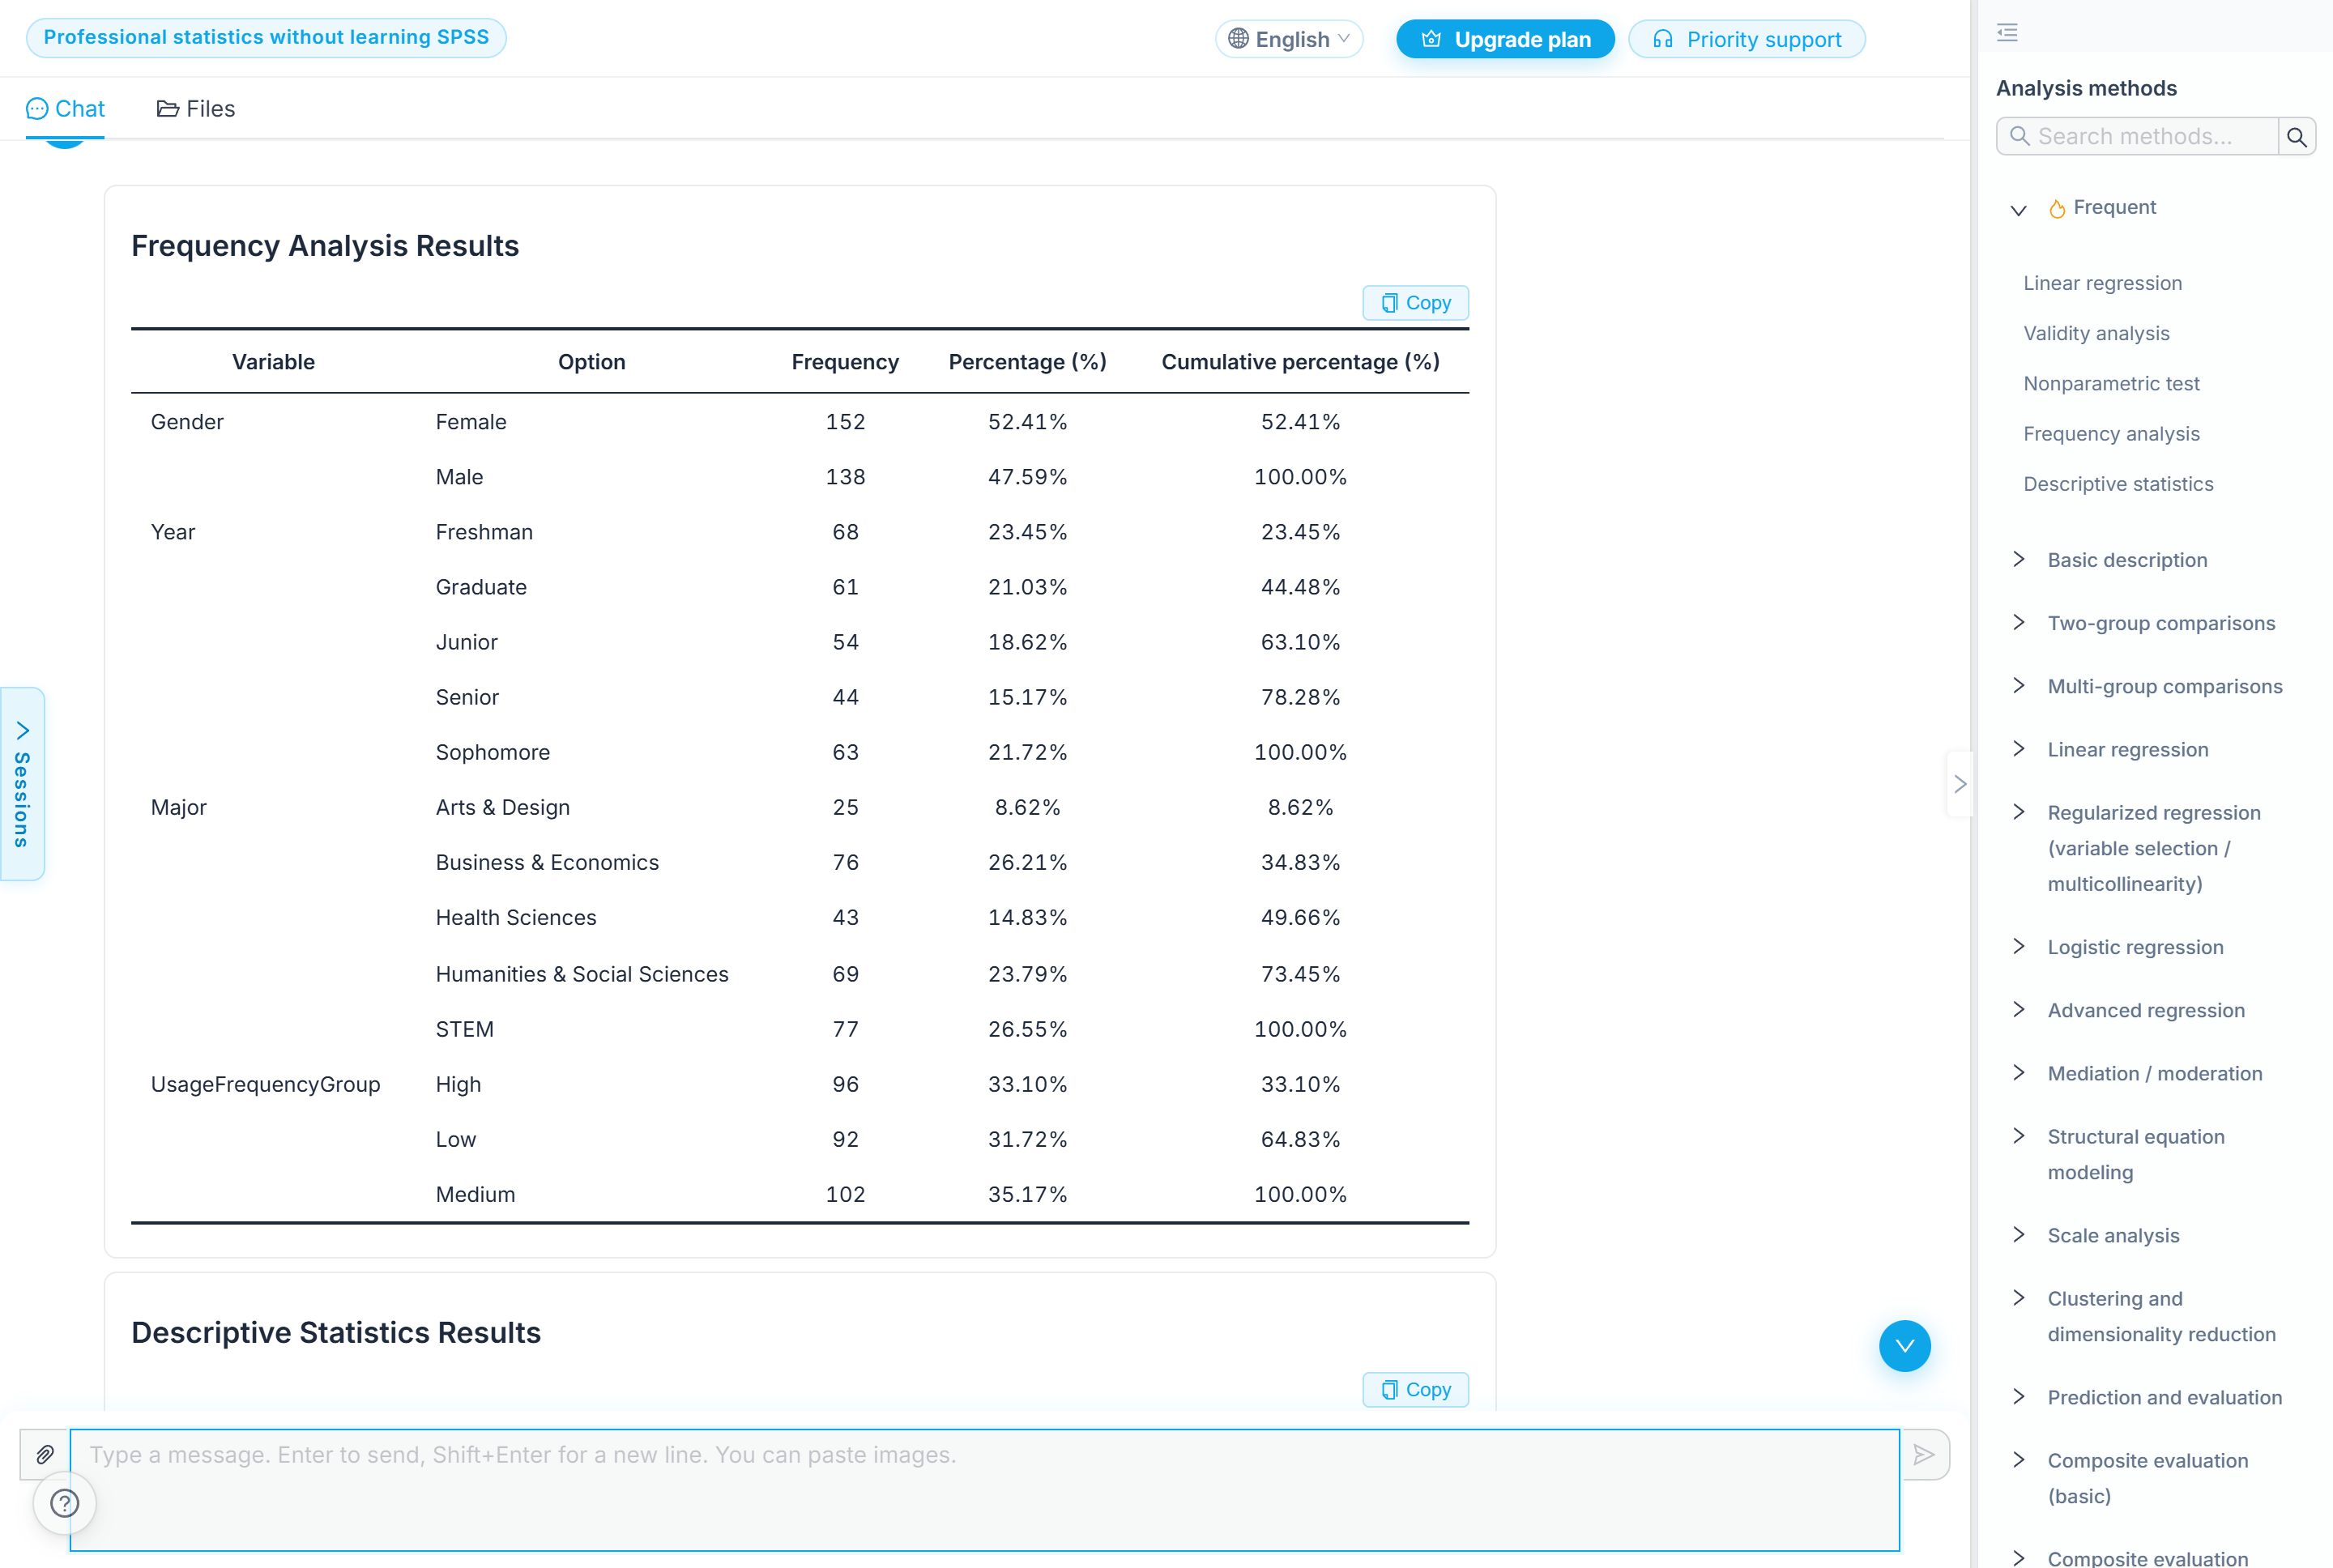 The ChatSRS interface this walkthrough was run in, before any result appears on screen.
The One-Line Prompt: Five Checks Named in Plain English
I uploaded the spreadsheet and typed one line: "I just collected a batch of survey responses and I want to work out which ones I can actually use. Can you run a data quality check for me: duplicate submissions, people who picked the same option all the way down, missing answers, values outside the allowed range, and anything that is obviously impossible. Tell me which ones to drop and how many are left." Five checks named in ordinary words — no mention of the term straightlining, which is exactly what "the same option all the way down" means — plus a request for the drop list and the final count.
It answered in kind: "I'll audit the raw responses at the submission level, using the stated 1–5 item ranges and checking whether any special codes are present. I'll distinguish confirmed invalid cases from responses that are unusual but still potentially valid, so the drop count is defensible." Before any results appeared, it also laid out the rules it was applying: "I'm checking both exact duplicate rows and duplicate response patterns independent of ID, then applying the apparent survey rules: binary fields must be Yes/No or Male/Female, Likert items must be 1–5, and hours must be nonnegative. I'll report suspicious outliers separately from confirmed invalid submissions, because an unusually high but mathematically possible usage value should not be dropped automatically."
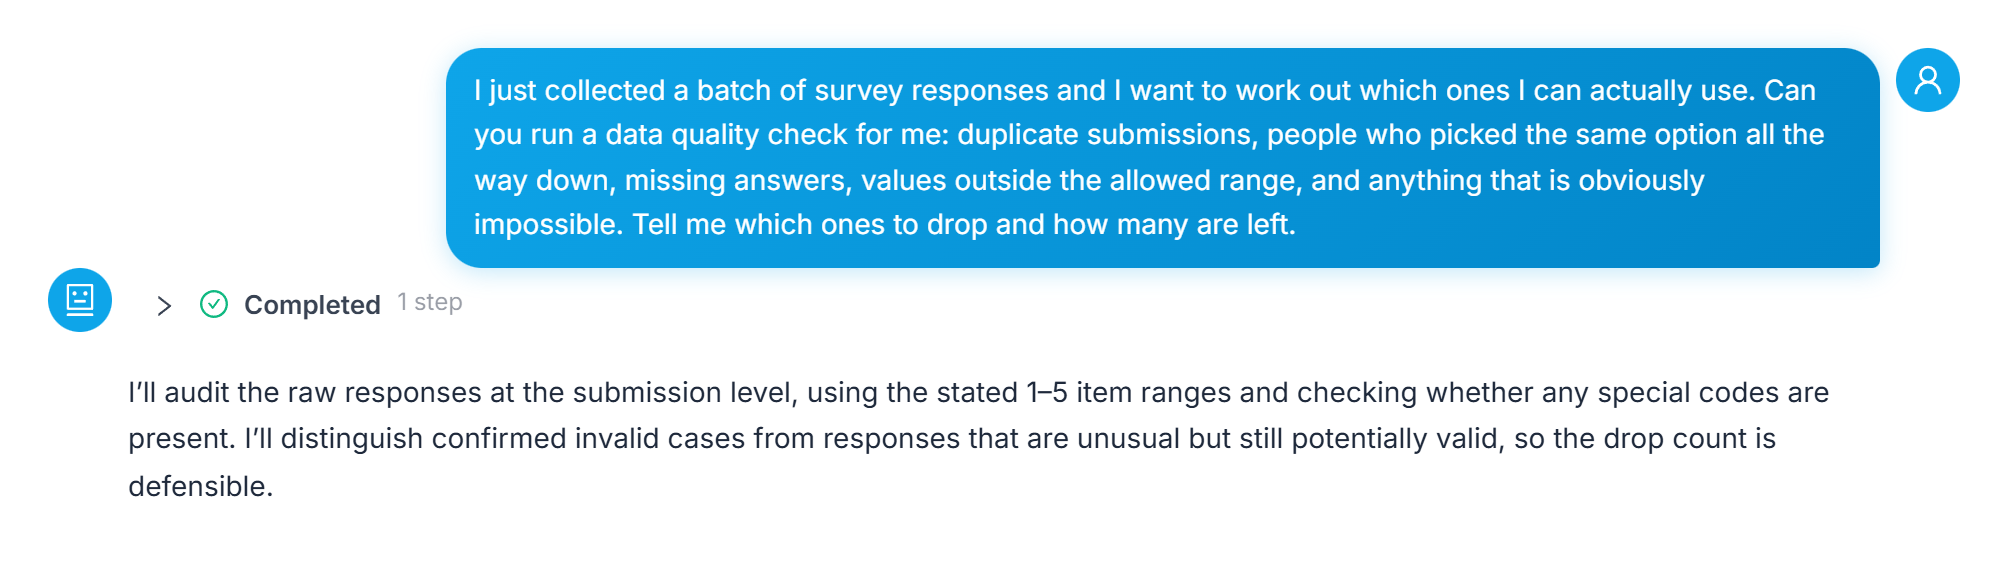 The one-line prompt that started the audit, and the assistant's reply laying out its rules before any verdict appeared.
Reading the Verdict: What Got Flagged and Why
What came back was one sentence carrying the whole verdict: "The audit found three clear range violations, eight submissions with at least one missing answer, three duplicated response pairs, and five fully straight-lined complete responses." Behind that sentence is a specific list of IDs. The three duplicated pairs were IDs 62, 177, and 184 — each submitted twice with identical answers, so one copy of each gets kept and the other dropped. The eight missing-answer rows were IDs 32, 58, 185, 115, 67, 92, 121, and 264. The three range violations were SI3 = 0 on ID 100, BI2 = 9 on ID 246, and BI4 = 0 on ID 300 — all outside the stated 1–5 scale. IDs 301 through 305 each answered every single item with one constant number straight down the survey; ID 302 was flagged as "especially suspicious because it combines complete straightlining with 38.1 hours of weekly AI use."
Two more IDs got a different treatment entirely. ID 306 reported 168 hours per week, which the audit called "not credible as actual AI-tool use" and dropped outright, while ID 307 reported 120 hours per week — "extremely implausible but not mathematically impossible" — and was flagged for manual verification rather than dropped automatically. Put together: 310 original rows, minus 3 duplicate excess rows, minus 8 missing-answer rows, minus 3 invalid-scale rows, minus 5 straightlining rows, minus 1 impossible-hours row for ID 306. "Recommended retained sample: 290 respondents." If ID 307 turns out to be genuine, the sample stays at 290; if you decide to treat it as implausible too, "the final sample becomes 289 respondents." Neither number is automatically the right one — which rule you apply is a call you make and then write down, not something the audit makes for you.
 The verdict sentence every specific ID in this walkthrough traces back to.
The Sample Table: What 290 Cleaned Respondents Look Like
I asked the follow-up in the same chat: "Now the sample description section. How many people and what percentage in each category for gender, year, major and usage frequency group; and for the five construct scores plus hours per week using AI tools, give me the mean, standard deviation, minimum and maximum." What came back is the sample table for the cleaned 290 — not a methods-paragraph description of one, the recomputed table itself.
Gender split 152 women (52.41%) to 138 men (47.59%). Year ran from 68 freshmen (23.45%) down to 44 seniors (15.17%), with "freshmen and sophomores together comprising 45.17% of the sample." Major put STEM largest at 77 (26.55%) and Arts & Design smallest at 25 (8.62%). Usage-frequency group split close to even:
| Category | Group | n | % |
|---|---|---|---|
| Gender | Women | 152 | 52.41% |
| Gender | Men | 138 | 47.59% |
| Usage-frequency group | High | 96 | 33.10% |
| Usage-frequency group | Medium | 102 | 35.17% |
| Usage-frequency group | Low | 92 | 31.72% |
Source: ChatSRS frequency analysis output on the cleaned demo sample, N = 290 (demo data, not real thesis data).
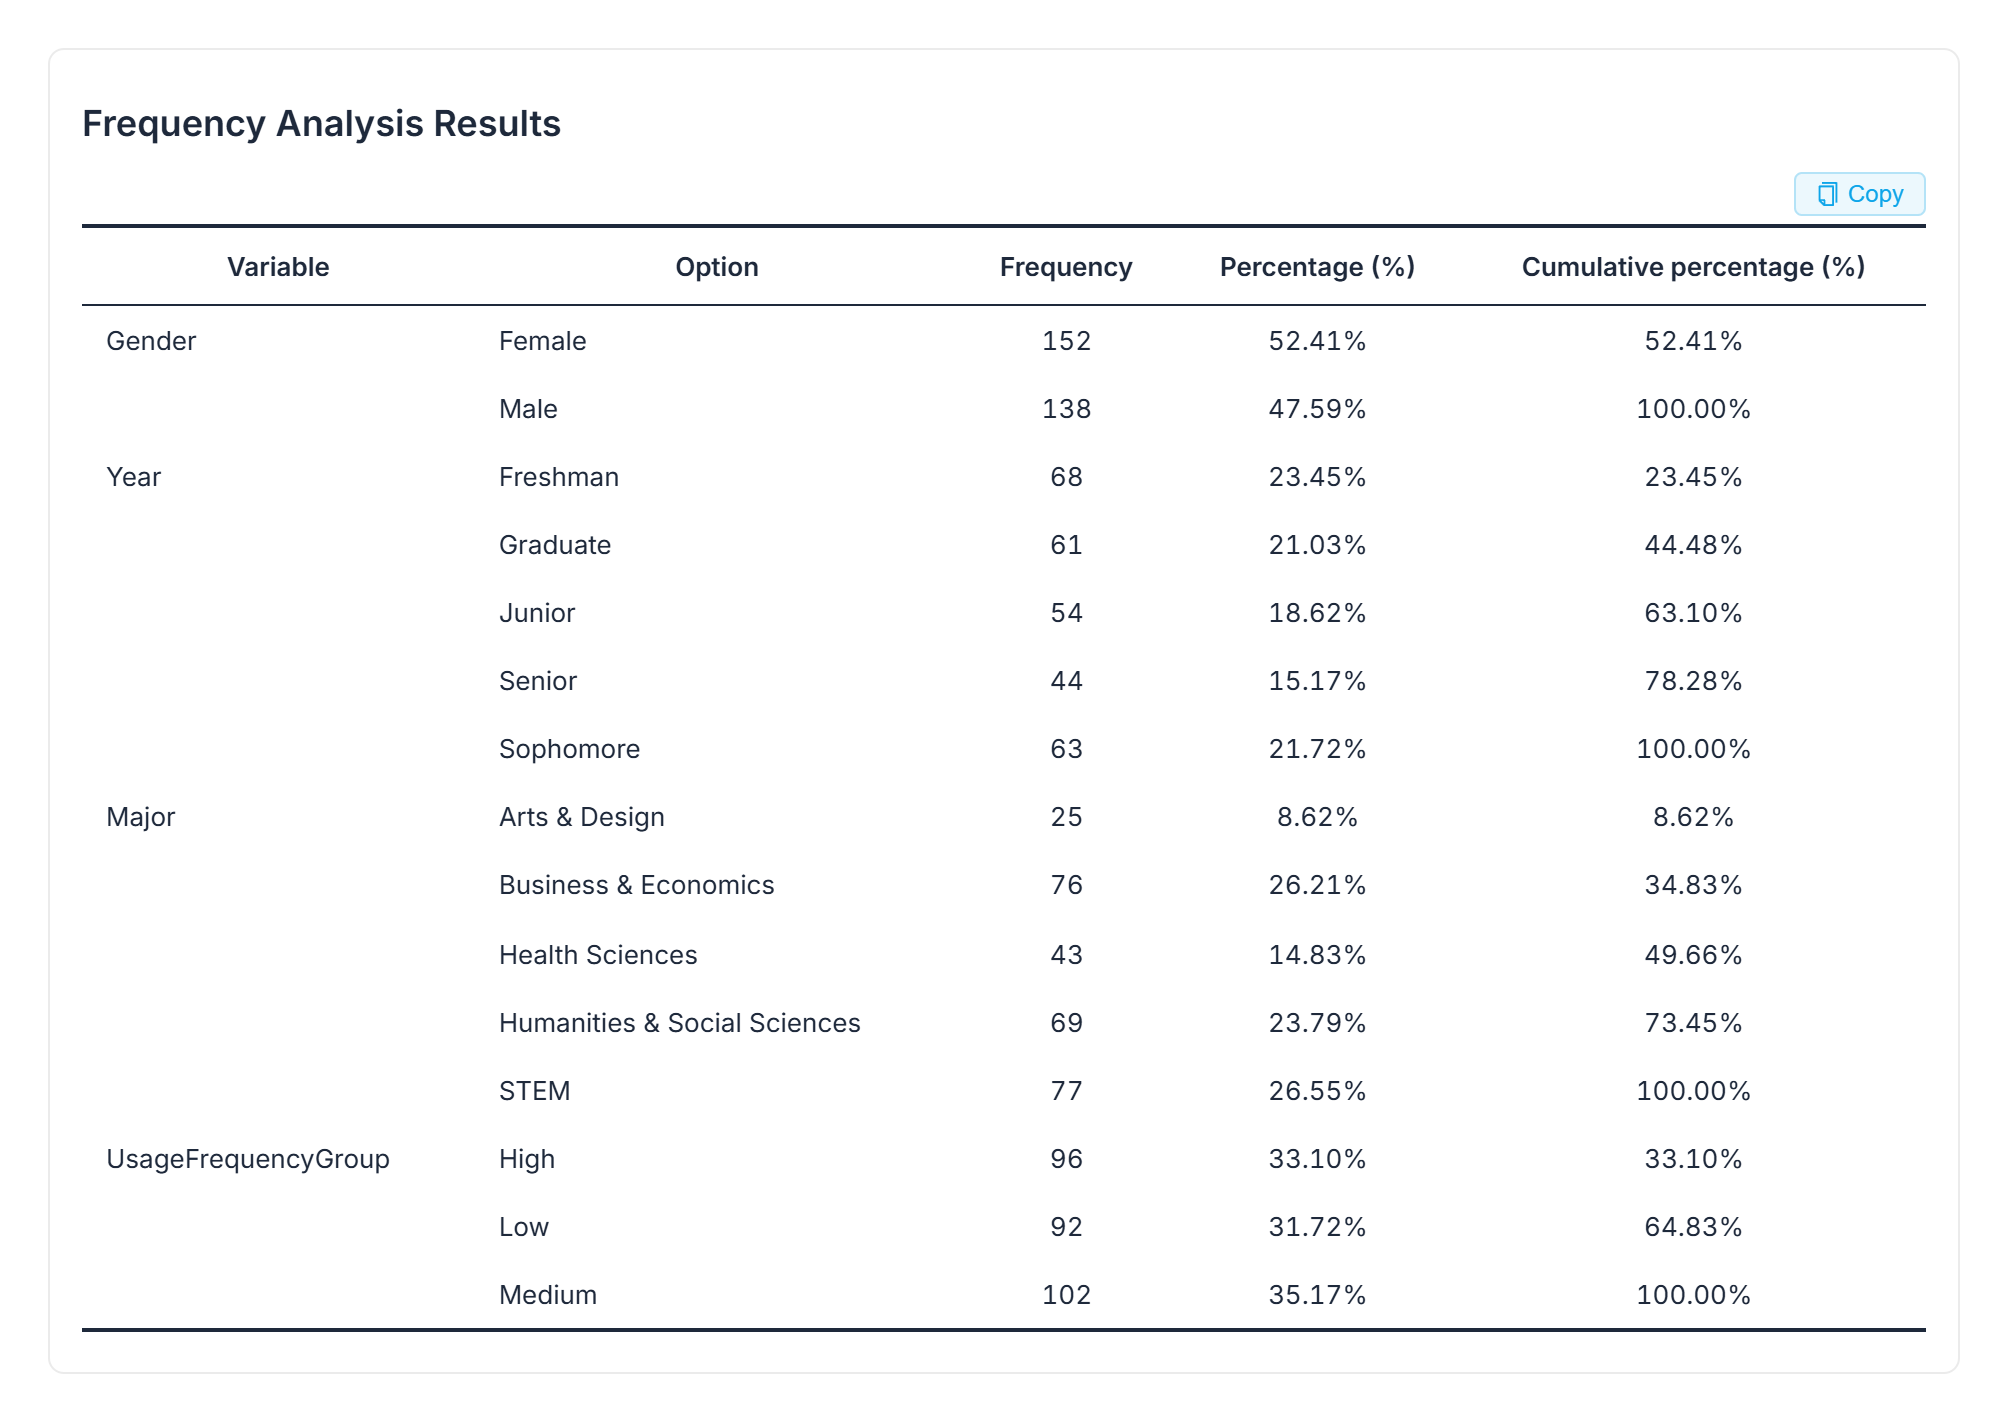 The frequency table once the excluded rows are actually gone — this is the sample table, not a description of one.
What This Walkthrough Doesn't Cover
- Reading what the mean, median, and standard deviation on this same cleaned sample actually say — and which one belongs in a results sentence when they disagree — is covered in how to report descriptive statistics in APA 7, on this same 290-person sample.
- Confirming that each construct's items belong together before you average them into a score is a reliability question; see how to run, interpret, and report Cronbach's alpha.
- Checking whether your questionnaire's items are measuring what they claim to measure, before you trust any score built from them, is covered in reliability and validity analysis for questionnaires.
- A recommended exclusion is a recommendation. Check the drop list yourself — particularly a borderline case like ID 307 — before you act on it.
Frequently Asked Questions
Do I need to know the term "straightlining" before I can ask for this check?
No. In this walkthrough the prompt described it in plain English — "people who picked the same option all the way down" — and ChatSRS ran the check without the term ever being used.
Does an unusually high value get dropped automatically?
Not on its own. In this run, a mathematically possible but extreme value (ID 307, 120 hours per week) was flagged for manual verification rather than dropped, while a value the audit called not credible (ID 306, 168 hours per week) was dropped outright. The distinction is stated, not automatic.
Why are there two possible sample sizes, 290 and 289?
Because one flagged case (ID 307) is extreme but not impossible. If you treat it as genuine, the retained sample is 290; if you decide to exclude it too, it becomes 289. Which rule to apply is a judgment call the audit surfaces but does not make for you.
Is the table I get back a description of my sample, or the actual sample table?
The actual table, recomputed on the cleaned data. In this walkthrough, the frequency table came back already built on the 290 retained respondents — frequency, percentage, and cumulative percentage per category.
Bottom Line
Descriptive statistics start with a cleaning pass, not a calculation. Naming five checks in plain English and reading the verdict sentence back — which IDs, which rule, how many are left — turns an intimidating audit into a table you can defend.
Run your own data-quality check in ChatSRS — upload your responses and get the drop list and the cleaned sample table back in the same conversation.