Statistical Tutorial ·
Independent-Samples T-Test Online: A Full Walkthrough With the Variance Check
A full walkthrough of running an independent-samples t-test online in ChatSRS: one plain-English prompt, the equal-variance check it went back for on its own, and the Welch's t-test switch that followed. Demo data, N = 290.
To run an independent-samples t-test online without missing its equal-variance assumption, upload your data and name the two outcomes, the grouping variable, and the variance check in one plain-English sentence — ChatSRS runs the comparison, and if the first table comes back without it, goes back for the check on its own. Below is a full walkthrough on demo data (N = 290).
What This Walkthrough Covers
An independent-samples t-test asks a simple question: do two groups differ on some outcome? Underneath that question sits an assumption almost nobody checks — that the two groups are similarly spread out, not just centered in different places. That assumption has a name, Levene's test, and most guides mention it once and most people never run it. Most of the time it doesn't matter, because the assumption holds. This is what happens on the run where it didn't.
This is a walkthrough on demo data — not real thesis data. A simulated survey, uploaded as a spreadsheet, 310 rows, cleaned down to a working sample of 290 respondents before any comparison ran. The two groups being compared are students who had attended AI-tool training and students who had not — 152 in the No group, 138 in the Yes group.
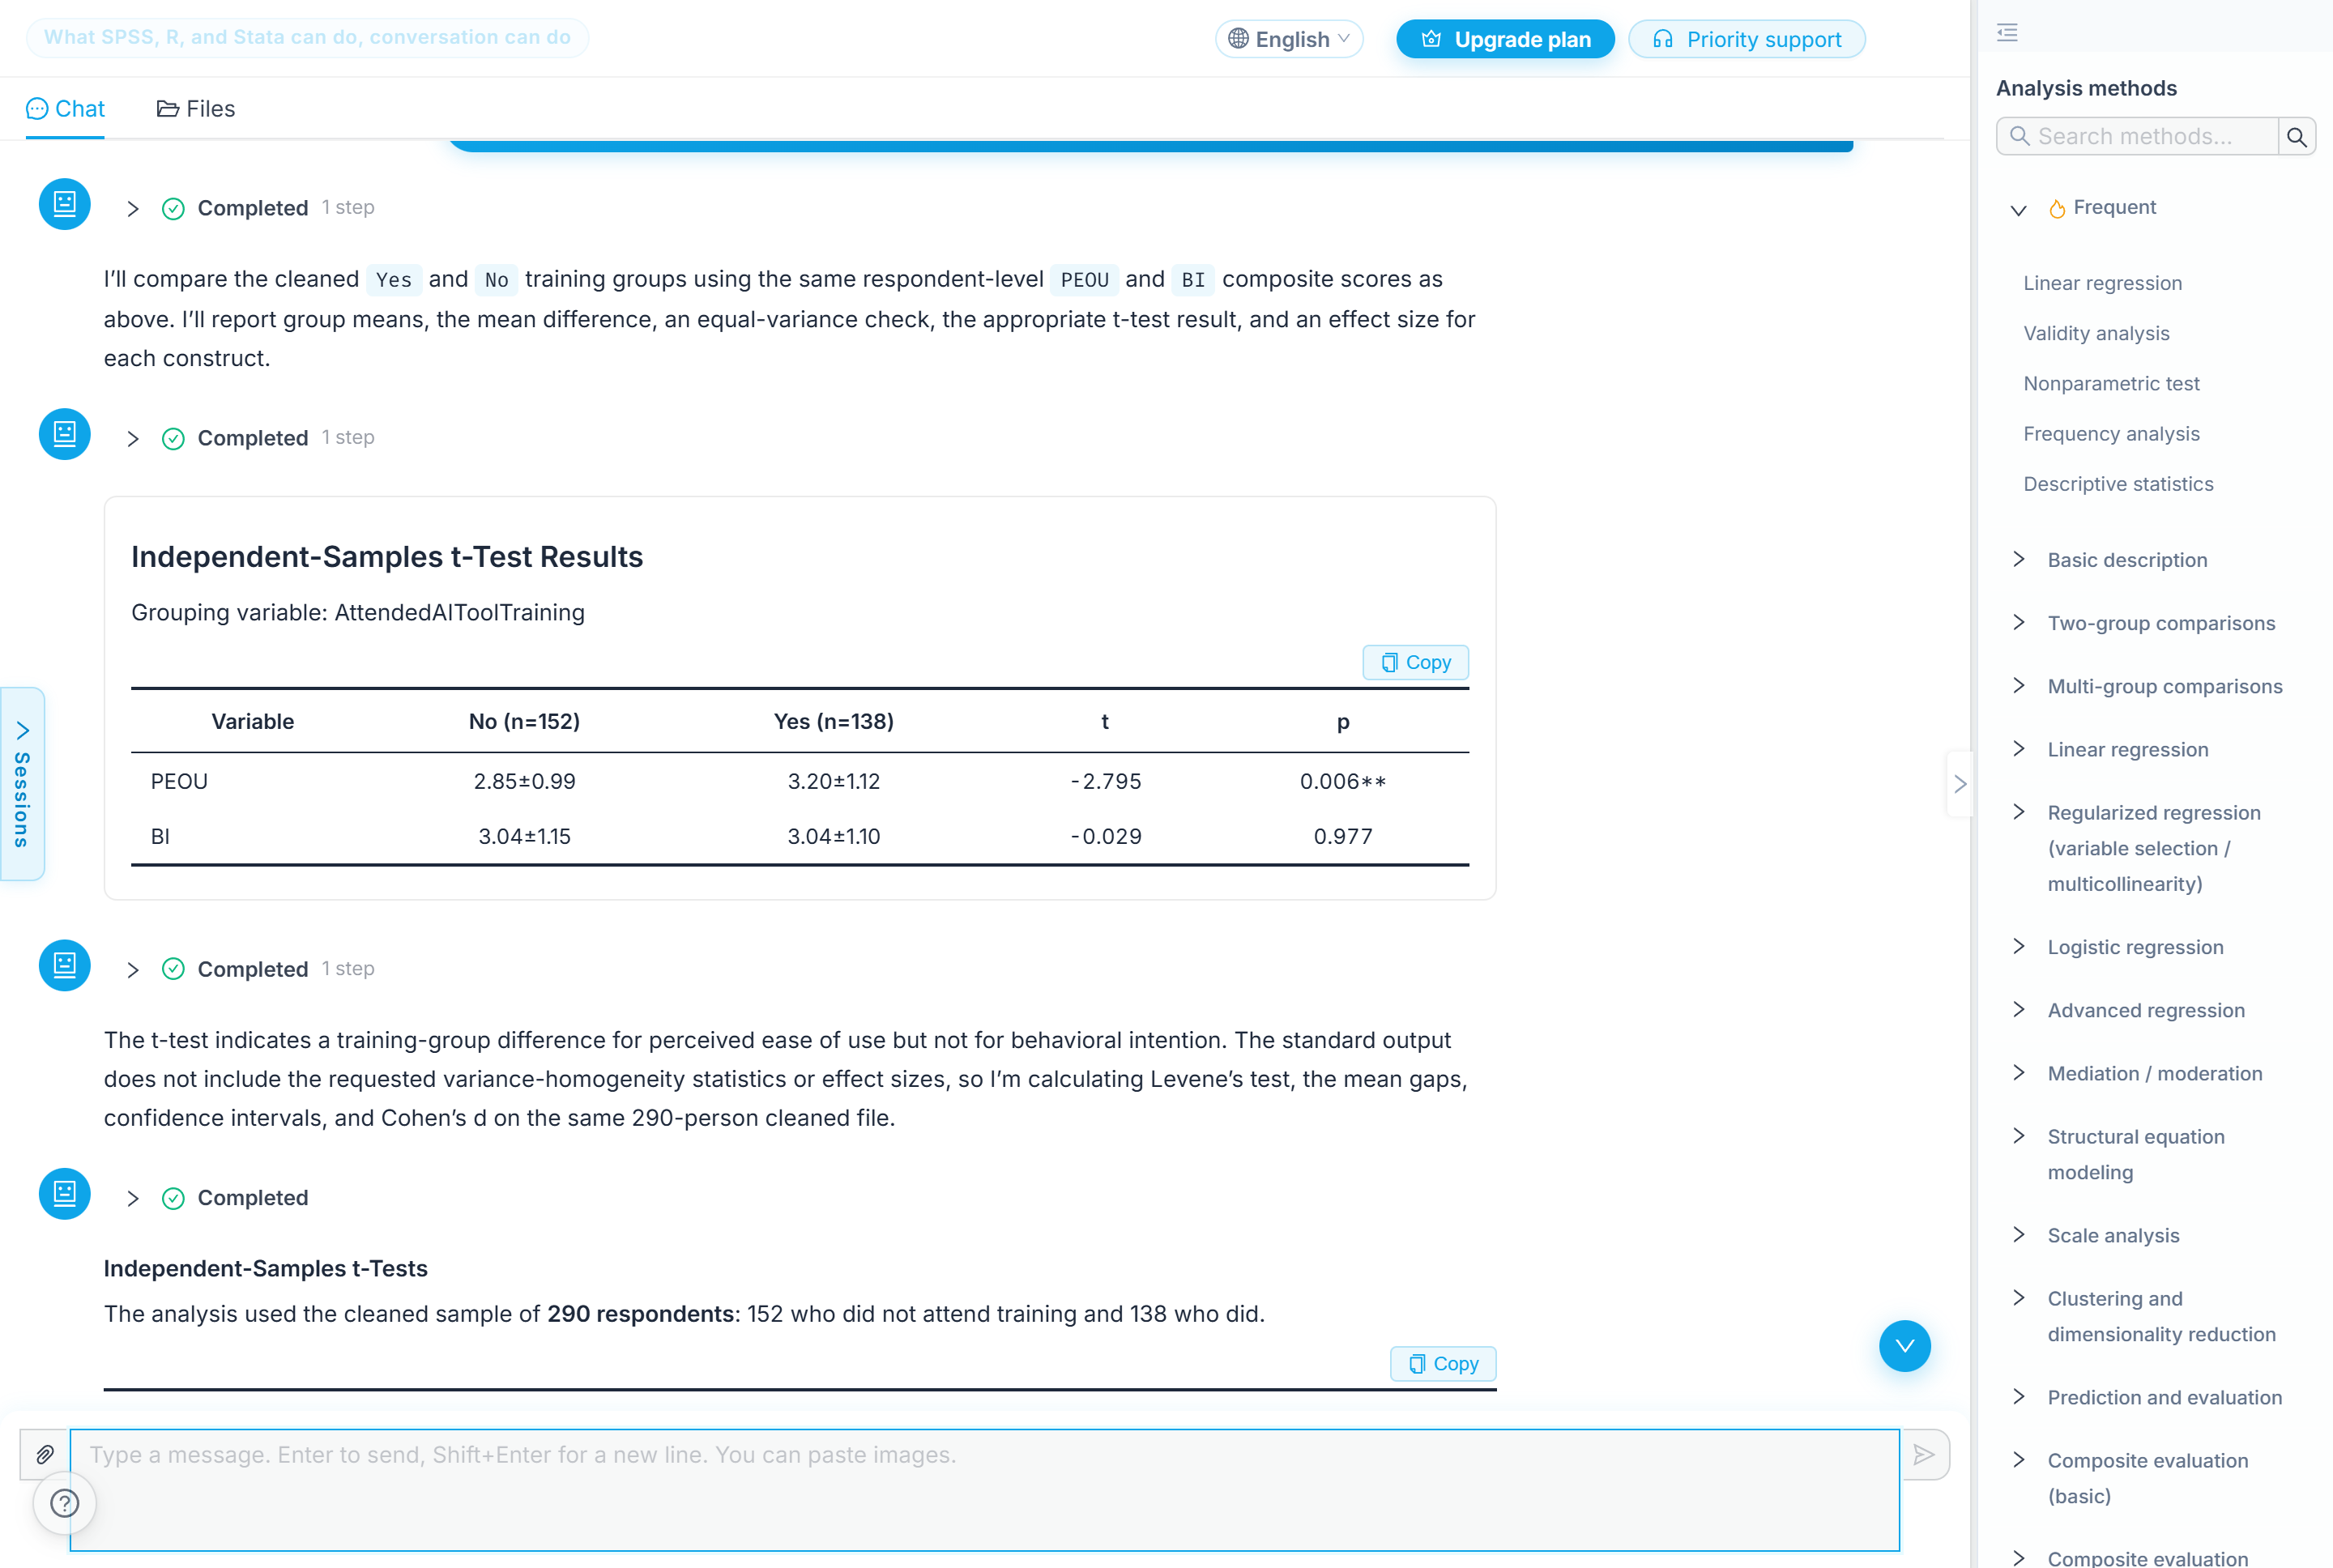 The ChatSRS interface this walkthrough was run in, with the demo survey file uploaded and ready to compare.
One Plain-English Prompt: Naming the Outcomes, the Grouping Variable, and the Variance Check
I uploaded the file and typed one line: "Run an independent samples t-test for me. I want to know whether people who attended AI tool training differ from people who did not on perceived ease of use; do the same for behavioral intention. Check whether the two groups have equal variances, and tell me how big the gap is." Three things had to be in that sentence: which two outcomes to test, which grouping variable to test them against, and the equal-variance check — asked for up front, not as an afterthought.
It confirmed the plan before running anything: "I'll compare the cleaned Yes and No training groups using the same respondent-level PEOU and BI composite scores as above. I'll report group means, the mean difference, an equal-variance check, the appropriate t-test result, and an effect size for each construct." Composite scores meaning the four survey items behind each construct, averaged into one score per respondent — a step I never spelled out and it filled in on its own.
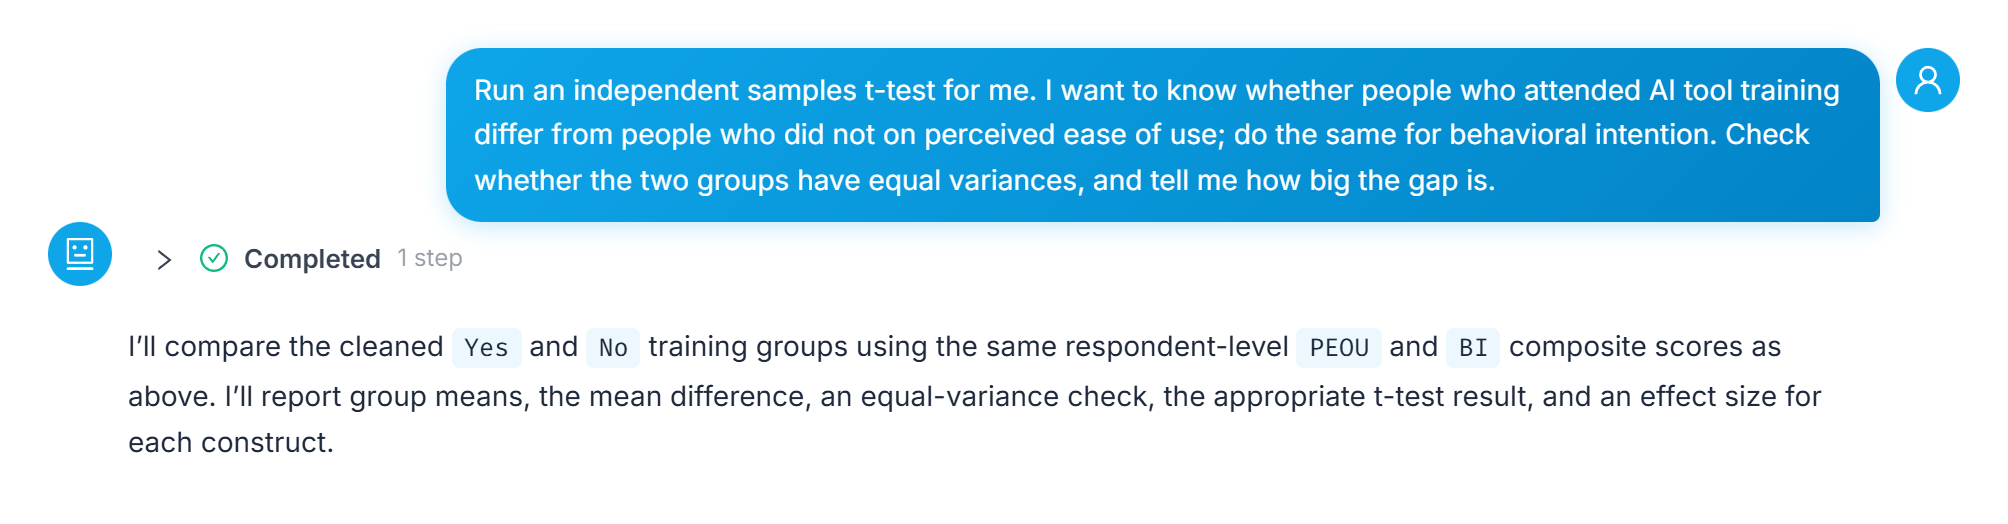 The one-line prompt that started the analysis, and the assistant's reply confirming the comparison before running it.
The First Table: T and P, No Variance Check Yet
What came back first: grouping variable AttendedAIToolTraining, No (n=152) against Yes (n=138).
| Outcome | No (n=152) | Yes (n=138) | t | p | Significant? |
|---|---|---|---|---|---|
| Perceived ease of use (PEOU) | 2.85 ± 0.99 | 3.20 ± 1.12 | -2.795 | 0.006** | Yes |
| Behavioral intention (BI) | 3.04 ± 1.15 | 3.04 ± 1.10 | -0.029 | 0.977 | No |
Source: ChatSRS independent-samples t-test output on simulated survey data, N = 290 (demo data, not real thesis data). Grouping variable: AttendedAIToolTraining, No (n=152) vs Yes (n=138).
One outcome moved, one didn't — and that table alone already reads like a finished answer.
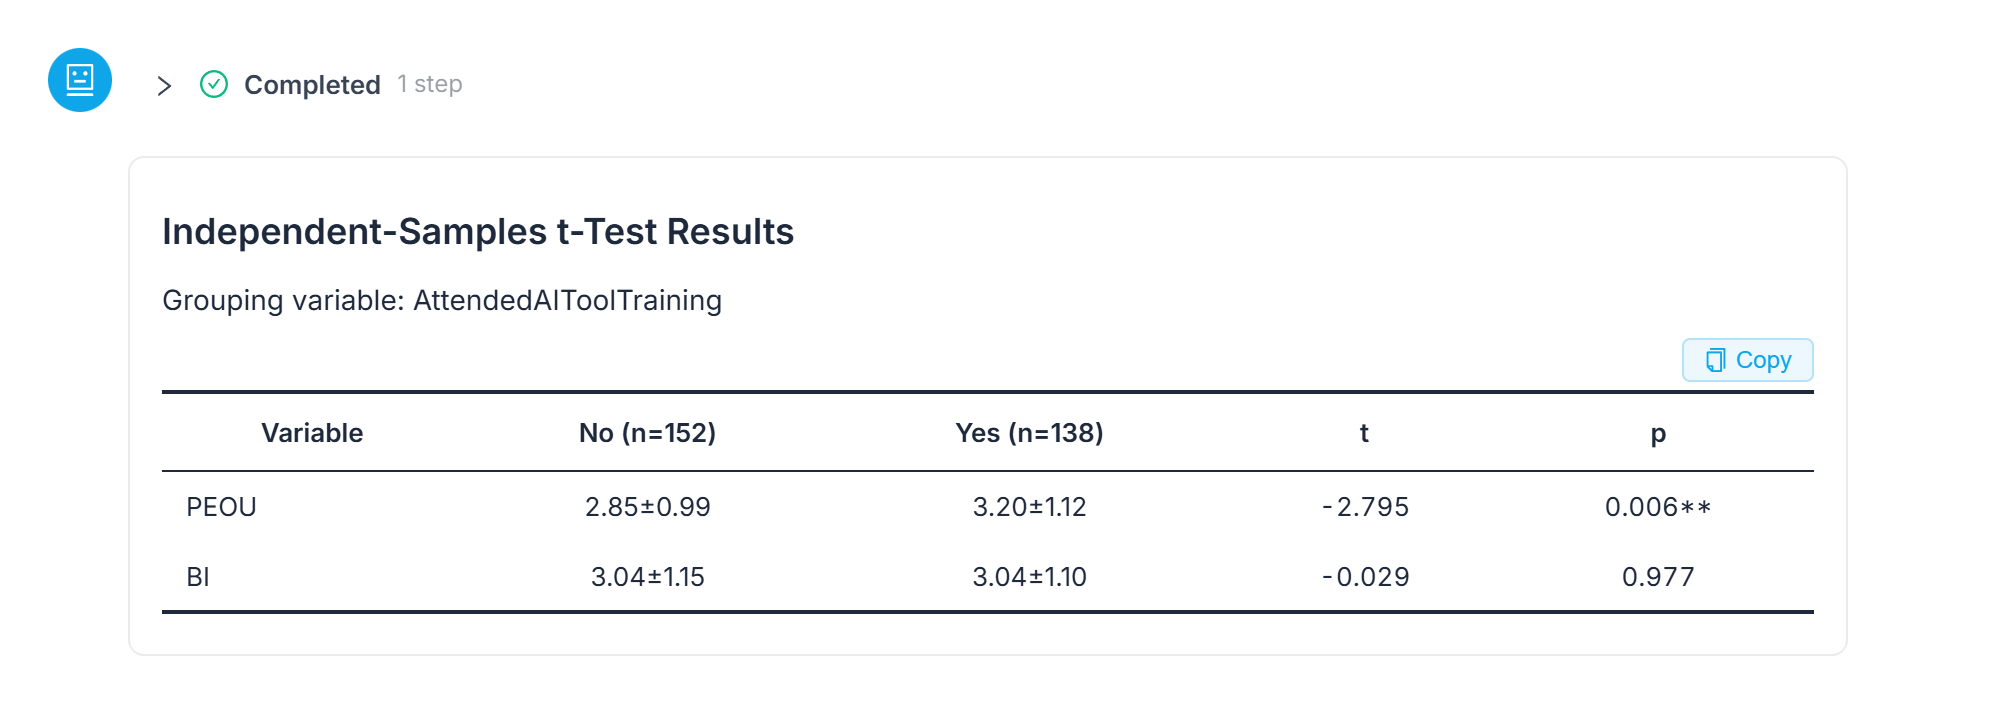 The table as it first came back — t and p for both outcomes, no equal-variance check yet.
It Wasn't Finished — Nobody Had to Point That Out
The very next message: "The t-test indicates a training-group difference for perceived ease of use but not for behavioral intention. The standard output does not include the requested variance-homogeneity statistics or effect sizes, so I'm calculating Levene's test, the mean gaps, confidence intervals, and Cohen's d on the same 290-person cleaned file." I hadn't asked a second time. It reread its own first answer, noticed the equal-variance check I had actually asked for in the original prompt wasn't in it, and went back for it.
The complete table opens with "The analysis used the cleaned sample of 290 respondents: 152 who did not attend training and 138 who did." Then the same two outcomes again, this time complete.
| Outcome | Levene's F | Levene's p | Test used | t | df | p | Cohen's d |
|---|---|---|---|---|---|---|---|
| Perceived ease of use (PEOU) | 5.209 | .023 | Welch's t-test | -2.778 | 272.7 | .006 | 0.329 |
| Behavioral intention (BI) | 0.062 | .804 | Pooled t-test | -0.029 | 288 | .977 | 0.003 |
Source: ChatSRS independent-samples t-test output, complete version, N = 290 (demo data, not real thesis data). PEOU: 2.852 (0.986) vs 3.197 (1.119), mean gap 0.345. BI: 3.038 (1.149) vs 3.042 (1.104), mean gap 0.004.
Because Levene's test for perceived ease of use is significant (p = .023), the table switches to the version built for unequal spread. A footnote spells out exactly why: "Welch's t-test was used for PEOU because Levene's test indicated unequal variances. The conventional pooled-variance result was substantively the same: t(288) = -2.795, p = .006." Behavioral intention's Levene's test came back not significant (F = 0.062, p = .804), so the ordinary t = -0.029, df = 288, p = .977, Cohen's d = 0.003 stands exactly as reported the first time.
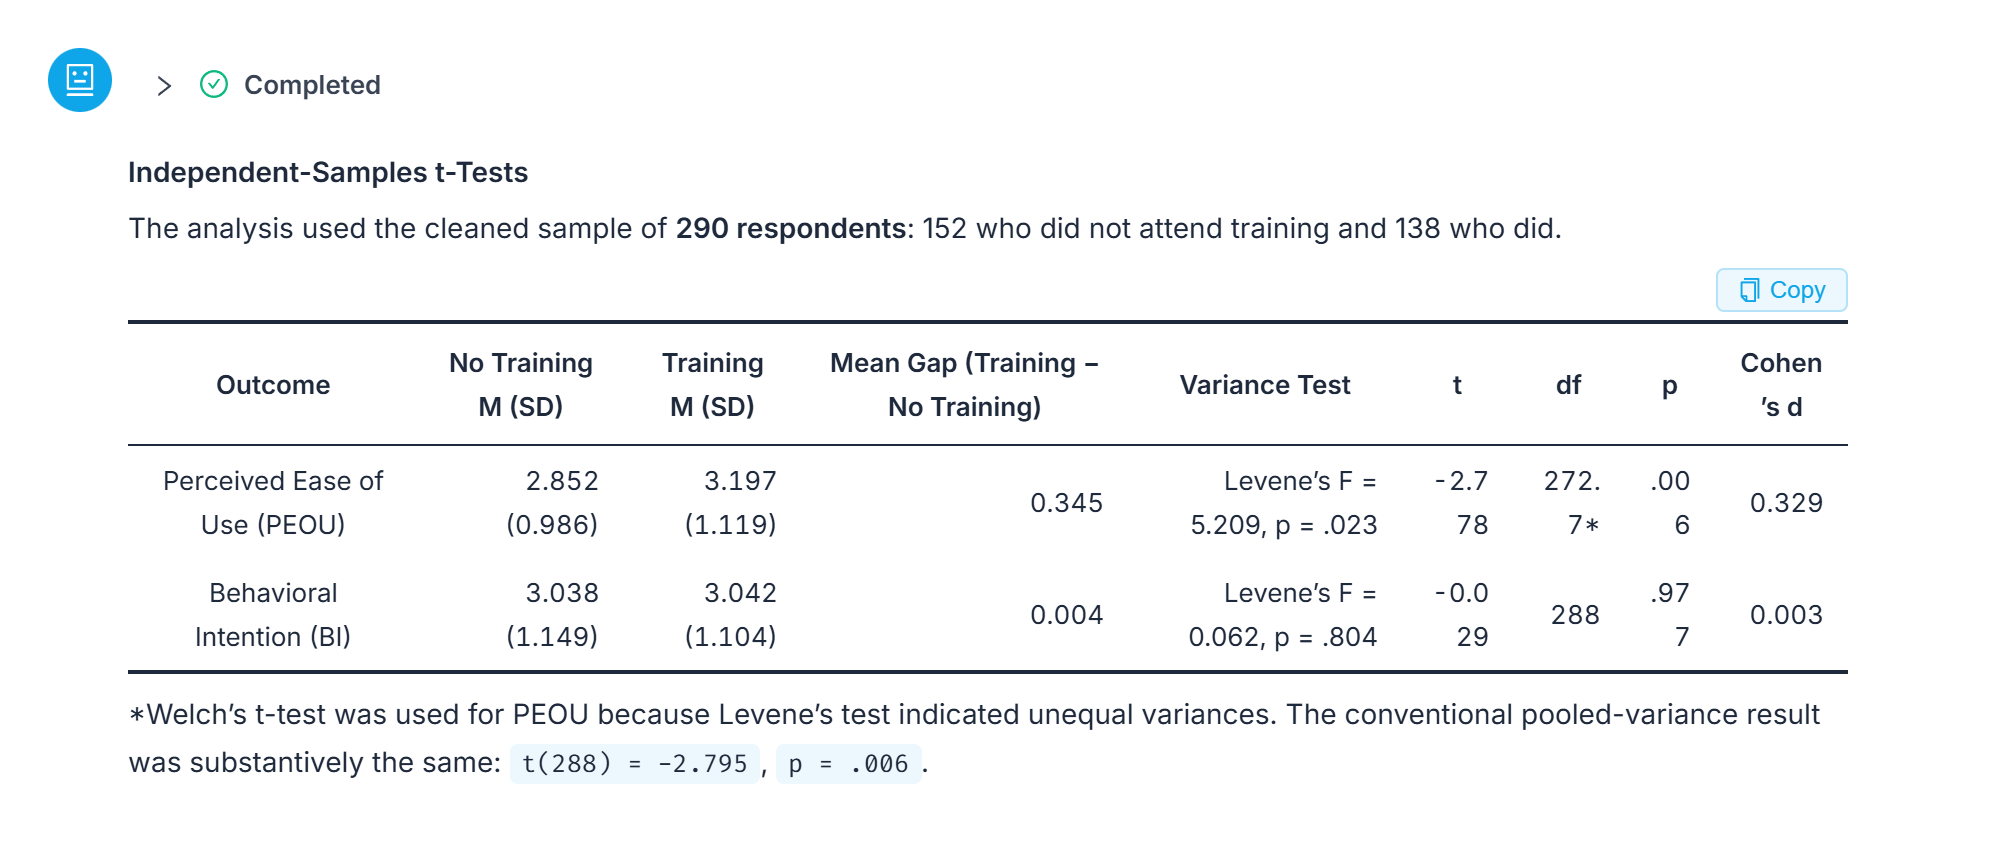 The complete table: Levene's F, the test actually used, Welch's t, and the footnote explaining why.
Reading Levene's Test: What "Significant" Means Here
Levene's test checks whether the two groups' scores are similarly spread out, not just centered differently. A significant result, as with perceived ease of use here, means the ordinary (pooled) t-test's assumption is violated, and Welch's version — built for unequal spread — is the one to trust. A non-significant result, as with behavioral intention, means the ordinary test was already the right tool.
Worth saying plainly: this switch didn't change the conclusion for perceived ease of use — the footnote shows the pooled version landed at essentially the same p-value. What it changed is whether you could trust that number in the first place. And a group difference here, from an observational comparison, is a difference to report, not proof that the training caused it. Check the AI's reasoning yourself before either number becomes a sentence in your thesis.
What This Walkthrough Doesn't Cover
- Reading both outcome rows side by side and writing the results paragraph when one is significant and the other isn't — that's covered in same grouping variable, two outcomes, one significant result.
- Confirming that each construct's items belong together before you average them into a composite score is a reliability question; see how to run, interpret, and report Cronbach's alpha.
- With cross-sectional demo data like this, the output can support a group difference or association but cannot by itself establish which variable causes which.
Frequently Asked Questions
Do I need to check equal variances myself before running a t-test, or can I ask the AI to do it?
You can ask for it in the same prompt. In this walkthrough, naming the equal-variance check in the original request was what mattered — and when the first table came back without it, ChatSRS reread its own answer and ran the check on its own.
What is Levene's test actually checking?
Whether the two groups' scores are similarly spread out around their own mean, not just centered in different places. It is a separate question from whether the group means differ.
If Levene's test comes back significant, does that mean my t-test is wrong?
No. It means the ordinary pooled t-test's equal-variance assumption doesn't hold, so Welch's t-test — which doesn't assume equal variances — is the version to report instead. In this example, the conclusion for perceived ease of use didn't change; only which version of the test you can trust did.
Does a significant t-test result mean the training caused the difference?
No. This is an observational comparison between two existing groups, not a randomized experiment. A significant result here is a group difference worth reporting, not proof of causation.
Bottom Line
An independent-samples t-test isn't finished at the t and p columns. Naming the equal-variance check in your prompt, and reading Levene's test before you trust the t-test version underneath it, is the difference between a table that looks finished and one that actually is.
Run your own independent-samples t-test in ChatSRS — bring your grouping variable and outcomes; the equal-variance check and the correct test version come back in the same pass.