Academic Reporting ·
T-Test Significant for One Outcome, Not Another? Here's How to Read Both Rows
Same grouping variable, same 290-person sample, two outcomes tested against it — one comes back significant, one doesn't. A full worked example of reading and reporting a split independent-samples t-test result.
When an independent-samples t-test comes back significant for one outcome and not another, on the same grouping variable and the same sample, the honest reading isn't "the groups differ" or "the groups don't differ" — it's that the two outcomes need to be read and reported separately, because "do the two groups differ?" was never a complete question. Below is a full worked example.
What This Guide Covers
This is the results-reading companion to running an independent-samples t-test online — same simulated survey data (N = 290), same grouping variable (whether a student had attended AI-tool training), same two outcomes (perceived ease of use and behavioral intention). That page covers running the comparison and the equal-variance check it went back for; this one covers what to do once one row comes back significant and the other doesn't.
Demo data throughout — a simulated survey cleaned to 290 respondents: 152 who had not attended AI-tool training, 138 who had. The grouping variable is attended AI-tool training, not gender.
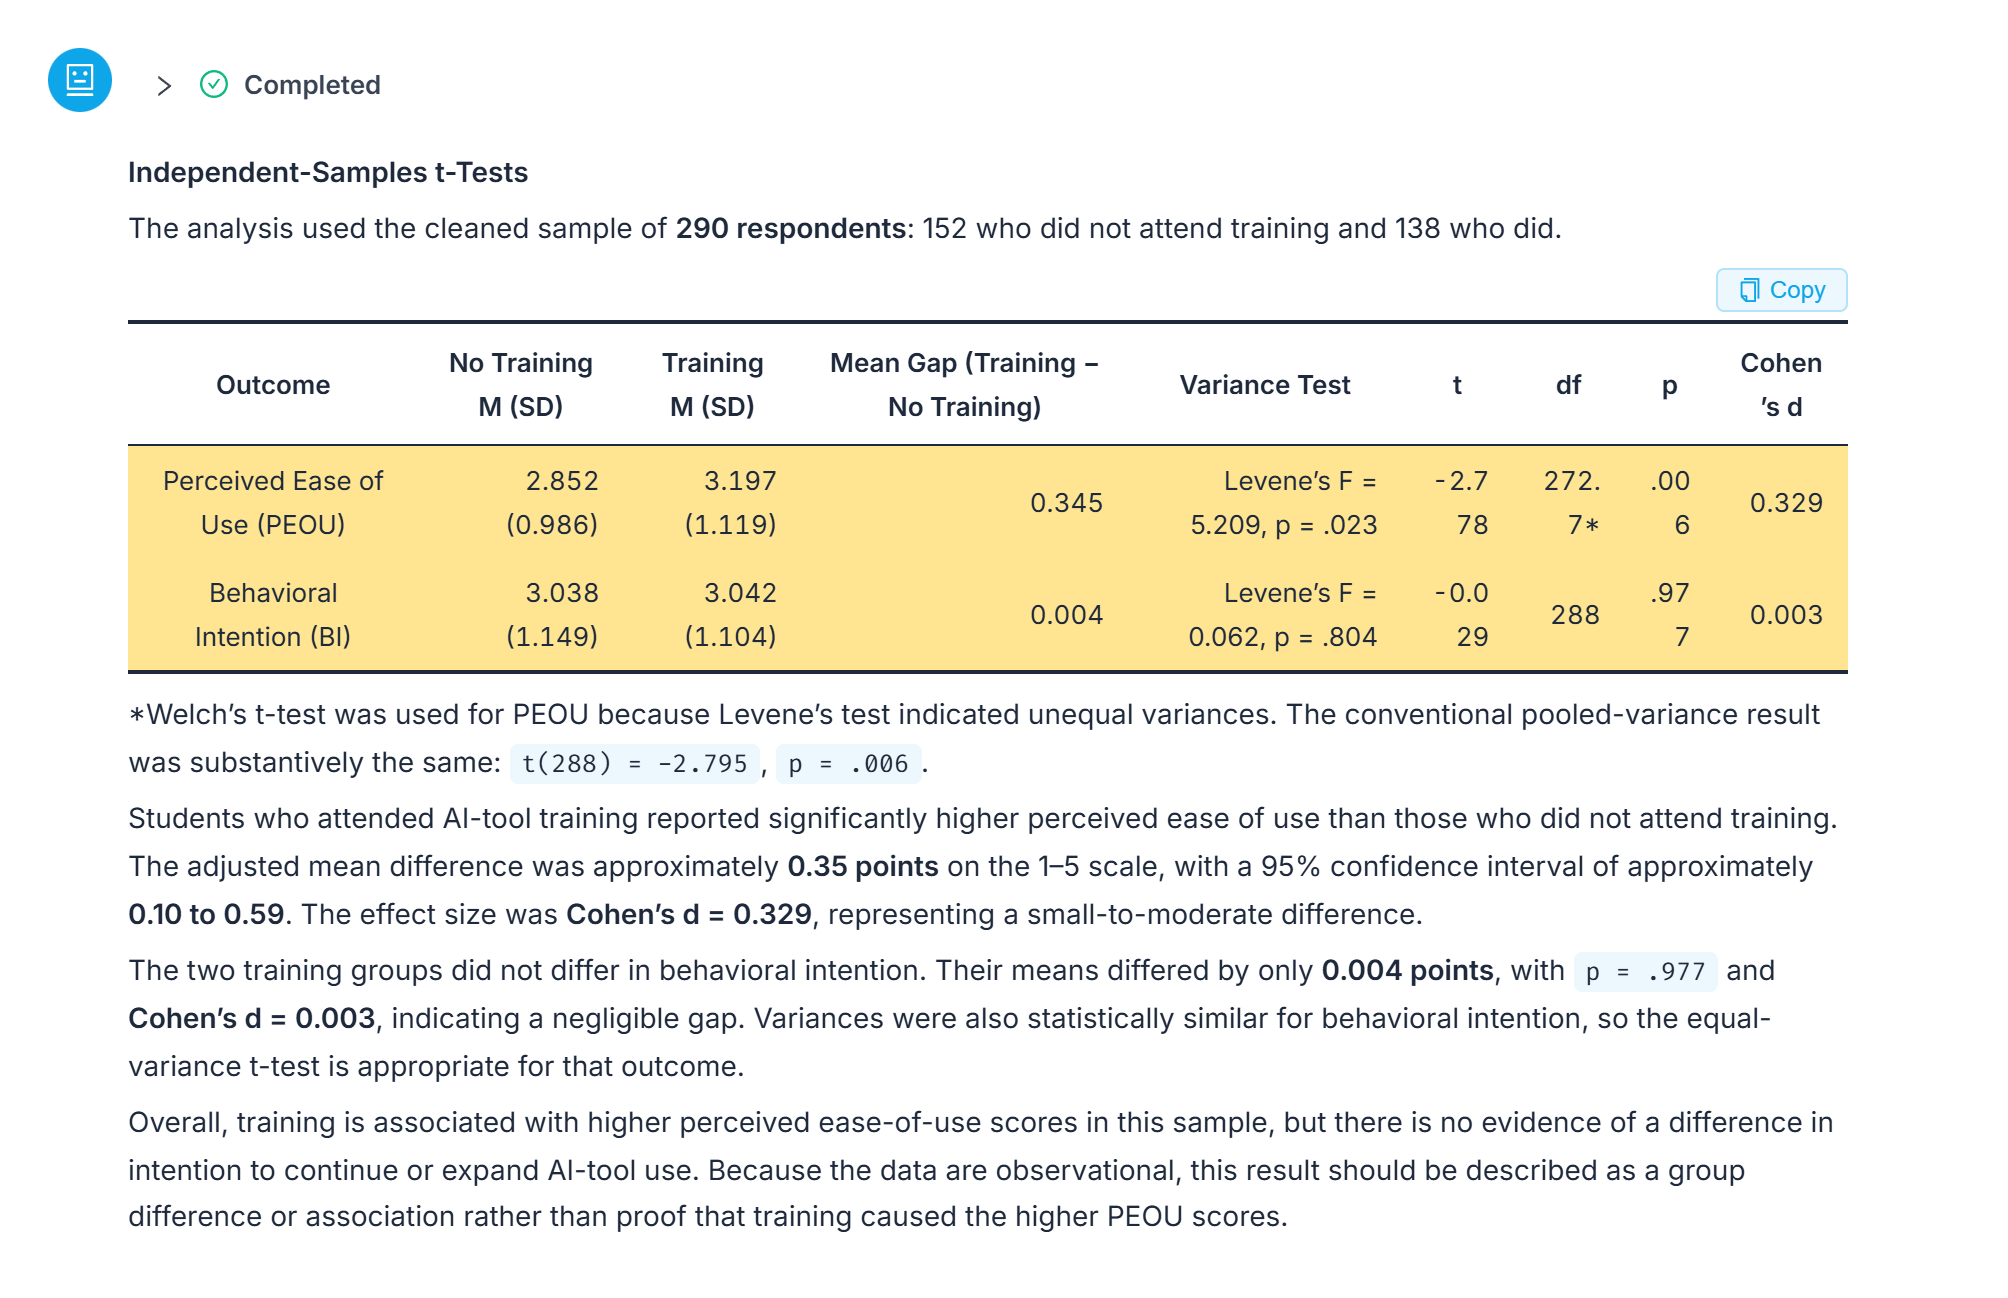 The full table with both rows highlighted — one outcome crosses the significance line, the other doesn't move.
Start With the Row That Moved
Perceived ease of use: no-training group 2.852 (0.986), training group 3.197 (1.119), a mean gap of 0.345. The variance check on this row reads Levene's F = 5.209, p = .023 — significant, so the table reports the version built for unequal spread: t = -2.778, df = 272.7, p = .006, Cohen's d = 0.329.
| Outcome | No-training | Training | Mean gap | t | df | p | Cohen's d |
|---|---|---|---|---|---|---|---|
| Perceived ease of use (PEOU) | 2.852 (0.986) | 3.197 (1.119) | 0.345 | -2.778 | 272.7 | .006 | 0.329 |
| Behavioral intention (BI) | 3.038 (1.149) | 3.042 (1.104) | 0.004 | -0.029 | 288 | .977 | 0.003 |
Source: ChatSRS independent-samples t-test output on simulated survey data, N = 290 (demo data, not real thesis data). Grouping variable: AttendedAIToolTraining, No (n=152) vs Yes (n=138).
In its own words: "Students who attended AI-tool training reported significantly higher perceived ease of use than those who did not attend training. The adjusted mean difference was approximately 0.35 points on the 1–5 scale, with a 95% confidence interval of approximately 0.10 to 0.59. The effect size was Cohen's d = 0.329, representing a small-to-moderate difference."
Now the Row That Didn't
Behavioral intention: no-training group 3.038 (1.149), training group 3.042 (1.104) — a mean gap of 0.004, far smaller than the gap for perceived ease of use. Levene's F = 0.062, p = .804, not significant, so the ordinary equal-variance test applies without modification: t = -0.029, df = 288, p = .977, Cohen's d = 0.003.
In its own words: "The two training groups did not differ in behavioral intention. Their means differed by only 0.004 points, with p = .977 and Cohen's d = 0.003, indicating a negligible gap. Variances were also statistically similar for behavioral intention, so the equal-variance t-test is appropriate for that outcome."
 The interpretation text zoomed in on the outcome that actually moved.
Reading Both Rows Together
Same file, same grouping variable, same 290 respondents — one outcome the training group cleared by approximately 0.35 points with a small-to-moderate effect size, the other landing within 0.004 points of the comparison group. A report that only said the training and no-training groups differed, or that they didn't, would be describing half of a real table while leaving the other half out.
Its own summary lands exactly where the two rows point: "Overall, training is associated with higher perceived ease-of-use scores in this sample, but there is no evidence of a difference in intention to continue or expand AI-tool use. Because the data are observational, this result should be described as a group difference or association rather than proof that training caused the higher PEOU scores." One outcome, a real difference; the other, none — and neither one, on this data, is a causal claim.
What Not to Do When the Two Rows Disagree
Reporting only the significant row, or treating the non-significant row as if it "proves" no relationship exists, are both incomplete reads of the same table. The non-significant row belongs in the results section exactly as it is — a mean gap of 0.004 and p = .977 is itself informative, not a gap in the report.
How Do You Write This Up?
Report both outcomes, in the same paragraph or table, with their own t, df, p, and effect size. Say plainly which one moved and which one didn't, and use the same careful language the output does: an association, not a causal claim, drawn from an observational comparison. A limit worth repeating in your own words: this is an association from observational groups, not a randomized comparison, and where the .05 line matters most for your results section is a conversation for your advisor, not for this table. Check the AI's reasoning yourself before either row becomes a sentence in your thesis.
What This Guide Doesn't Cover
- How the equal-variance check itself works, and why perceived ease of use switched to Welch's t-test while behavioral intention didn't — that's covered in the full independent-samples t-test walkthrough.
- Whether either construct's items belong together before being averaged into a composite score is a reliability question, not a t-test question; see how to run, interpret, and report Cronbach's alpha.
- With cross-sectional demo data like this, a significant row supports an association, not a causal claim.
Frequently Asked Questions
Does one significant and one non-significant outcome mean something went wrong with the analysis?
No. The same grouping variable can relate to one outcome and not another — that's a normal result, not an error. "Do the two groups differ?" needs to be asked separately for each outcome.
Should I only report the outcome that came back significant?
No. Both rows belong in the results section. The non-significant row (mean gap of 0.004, p = .977 in this example) is itself informative and dropping it distorts what the comparison actually showed.
Does a significant group difference mean the training caused it?
No. This is an observational comparison between two existing groups, not a randomized experiment. The honest phrasing is a group difference or association, not proof of causation.
Why does one outcome use Welch's t-test and the other use the ordinary version?
It depends on Levene's test for each outcome. Perceived ease of use had unequal variances (Levene's p = .023), so Welch's t-test was used; behavioral intention had equal variances (Levene's p = .804), so the ordinary pooled t-test applied. The full check is walked through in the independent-samples t-test walkthrough.
Bottom Line
A split result across two outcomes isn't a contradiction to explain away — it's two separate findings on the same grouping variable, and reporting both, with their own numbers and their own careful wording, is what the table is actually telling you.
Read your own t-test output in ChatSRS — compare multiple outcomes against the same grouping variable and get wording you can adapt when the rows don't agree.