Statistical Tutorial ·
How to Run a Moderation Analysis With a Categorical Moderator
How to run a moderation analysis with a categorical moderator in ChatSRS: one plain-English prompt handles the dummy coding, the reference group, and both interaction terms. Demo data, N = 300.
A moderation analysis with a categorical moderator tests whether the relationship between two continuous variables holds with the same strength across three or more groups. This walkthrough runs one in ChatSRS from a single plain-English prompt — dummy coding, the reference group, and the interaction terms are all handled for you.
What This Walkthrough Covers
Moderation is not conceptually hard; the setup is what slows people down. A continuous predictor needs centring, a grouping variable needs dummy coding against a chosen reference group, and interaction terms then get built by hand — get one step wrong and everything downstream is wrong with it. None of that setup is the actual question: does the same relationship hold with the same strength for different kinds of people? Finding AI tools useful and intending to keep using them obviously go together — but is that link equally strong for a constant user as for someone who barely touches it?
The data below is a simulated survey (demo data, N = 300), split into low-, medium-, and high-usage-frequency groups of 100 each — not real thesis data.
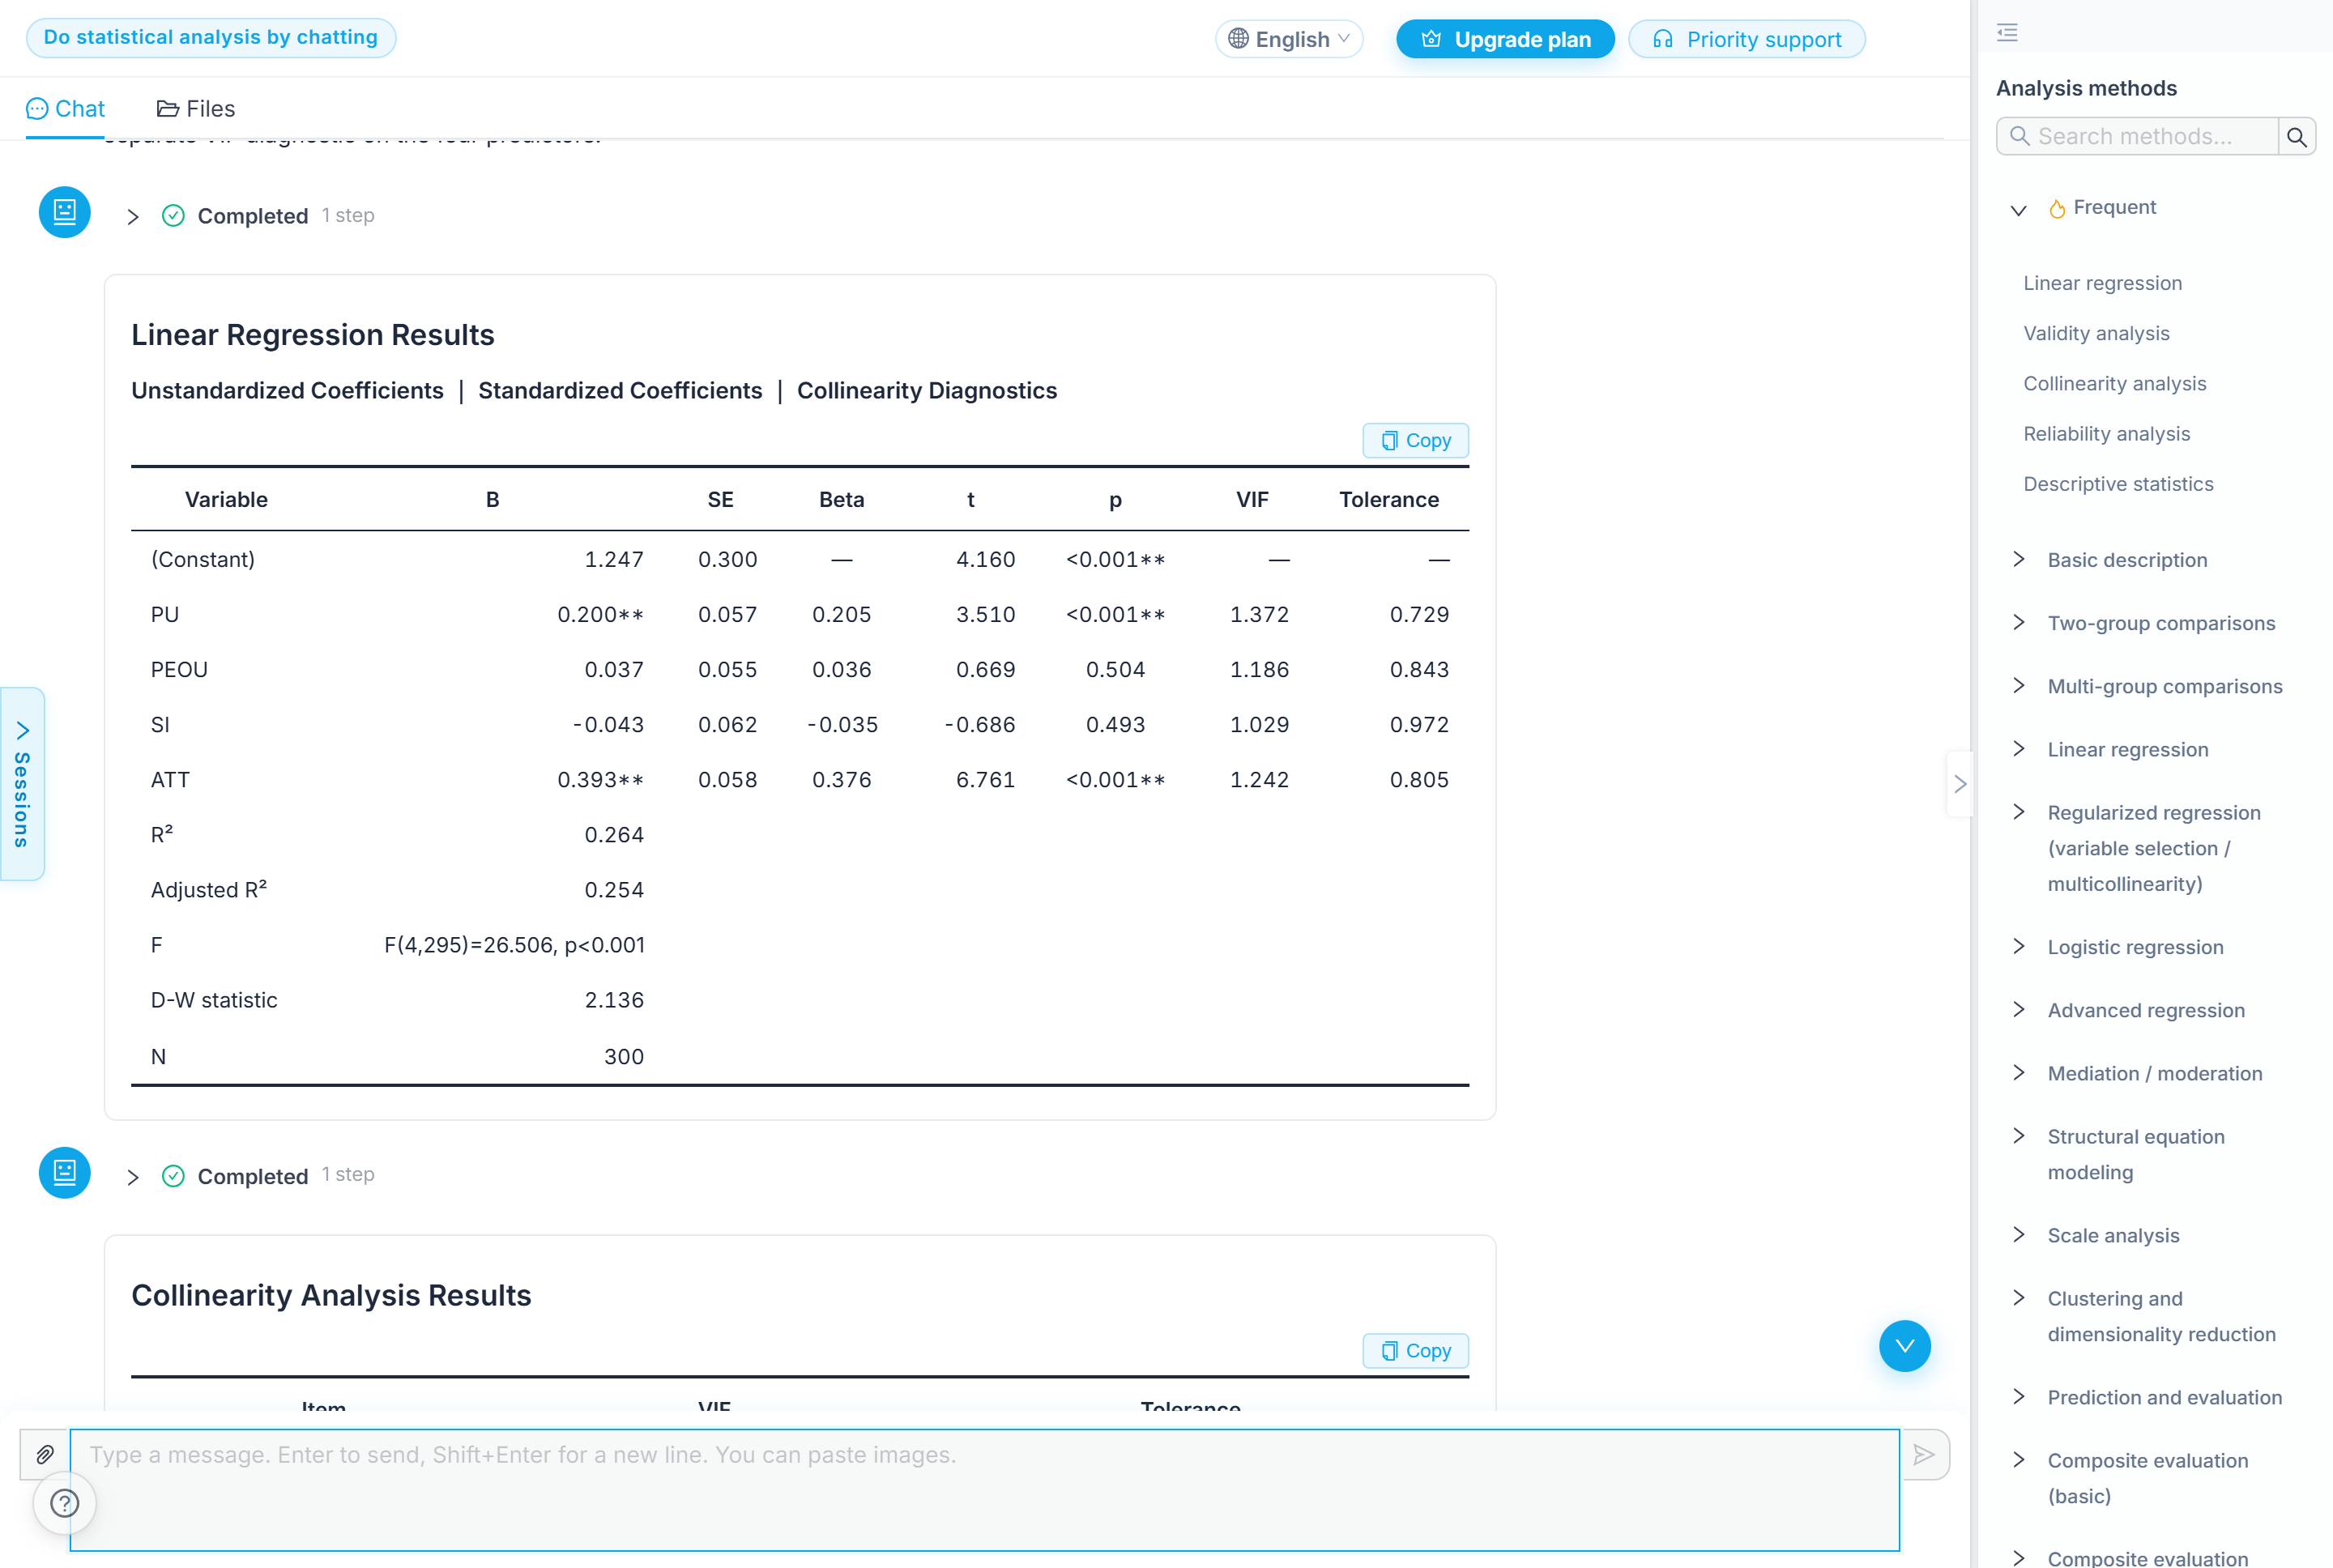 Moderation sits in the same method panel as mediation — a related but distinct technique; see the mediation walkthrough if that is the question you are actually asking.
How to Run It: One Prompt, No Manual Dummy Coding
The request was one plain-English line, typed straight into the chat box:
"Same data — can you run a moderation test for me? I want to know whether perceived usefulness matters differently for people who use AI tools a lot versus people who barely use them. Split them into low, medium and high usage groups, and show me both the interaction term and what each of the three groups looks like on its own."
Centring, dummy variables, reference groups, and interaction terms are all absent from that sentence — working those out is the model's job, not the researcher's.
What it did next is the part worth watching. It picked the statistical model first, and said why: "The moderator is a three-level category, so the appropriate model uses low usage as the reference group and tests two interaction terms: usefulness × medium use and usefulness × high use. This directly tests whether the usefulness slope differs from the low-use group, then I will estimate the usefulness slope within each group." That is the design decision a researcher would otherwise make by hand — with three groups, one interaction term is not enough, and stating the choice before running anything is what makes the output checkable.
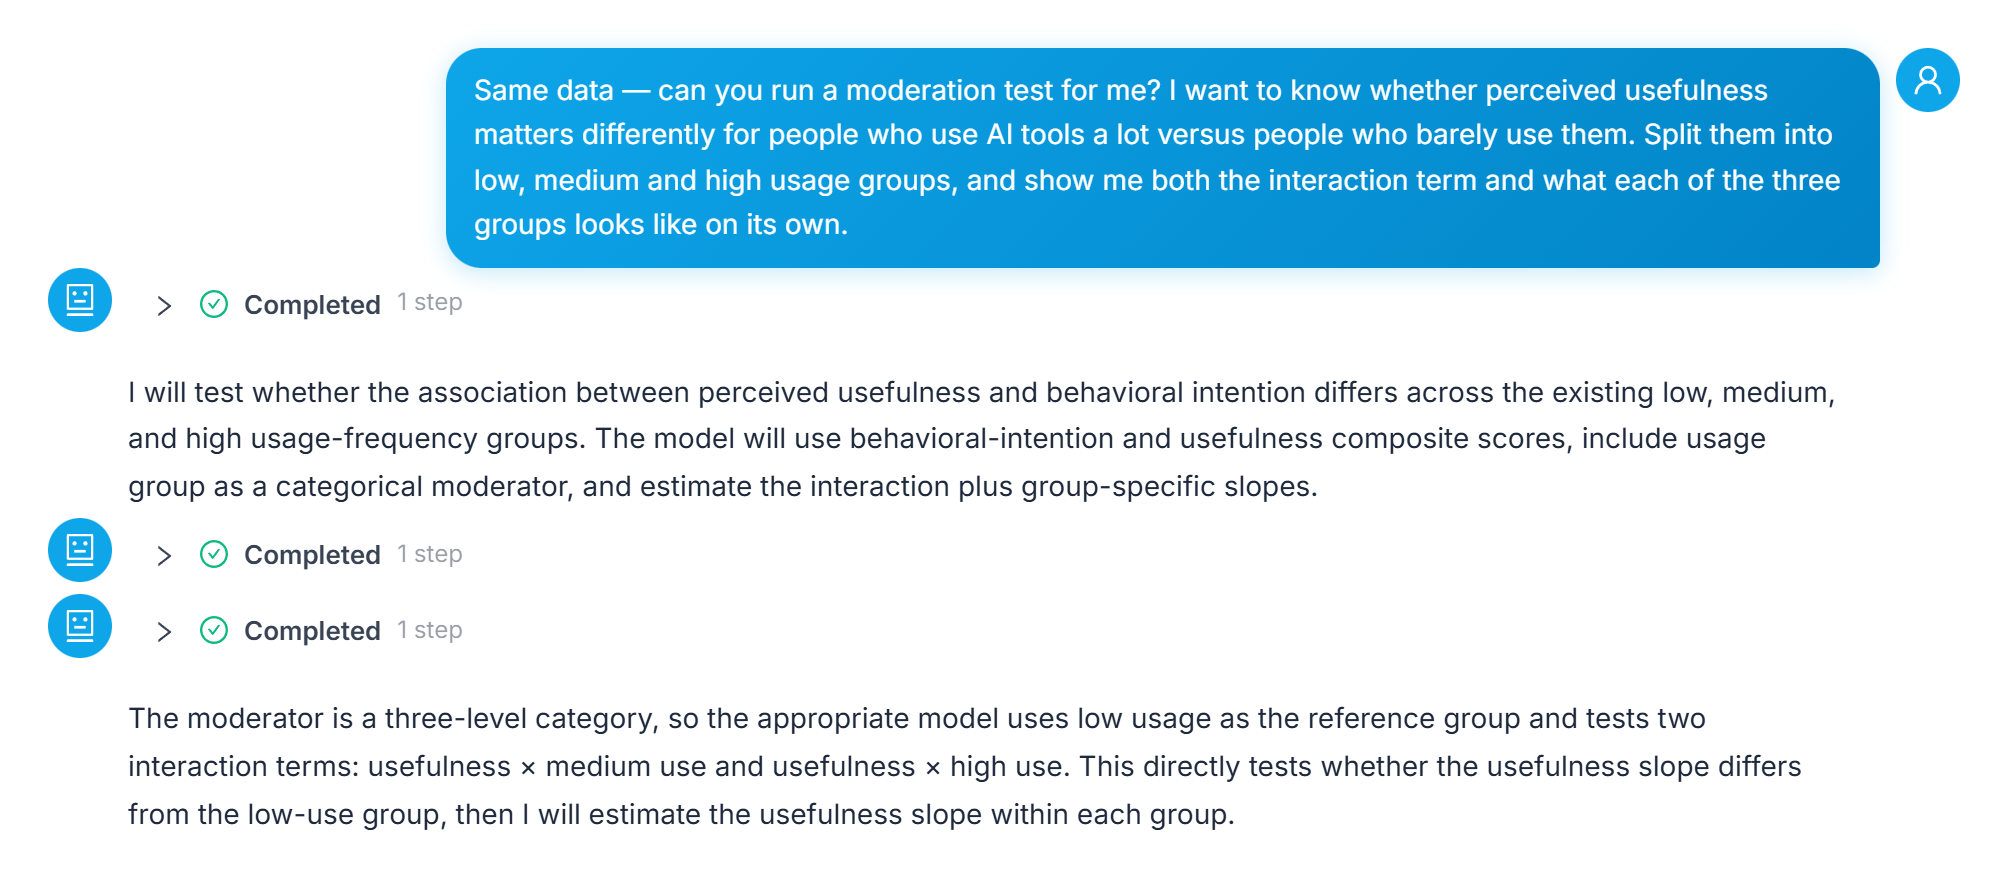 The prompt above, uncut, followed by the model's own explanation of why it chose low-use as the reference group and two interaction terms.
Reading the Output: Six Rows, Two That Matter
The model that came back has six rows: the constant, PU_c (perceived usefulness, centred), Medium and High (the two dummy variables against low use), and PUxMedium and PUxHigh (the two interaction terms). Model overall: F(5, 294) = 15.479, p < 0.001, R² = 0.208, adjusted R² = 0.195.
| Row | B | p | What it tests |
|---|---|---|---|
| PU_c (perceived usefulness, centred) | 0.430 | < 0.001 | Whether usefulness predicts intention at all |
| Medium (vs. low use) | 0.298 | 0.025 | Whether medium-use students report different intention than low-use students |
| High (vs. low use) | 0.632 | < 0.001 | Whether high-use students report different intention than low-use students |
| PU_c × Medium | -0.057 | 0.657 | Whether the usefulness-to-intention slope differs for medium- vs. low-use students |
| PU_c × High | -0.037 | 0.769 | Whether the usefulness-to-intention slope differs for high- vs. low-use students |
Source: ChatSRS moderation analysis output on simulated survey data, N = 300, three usage-frequency groups of 100 each.
PU_c and both group rows come in strong. Then the two rows the whole analysis exists for — PUxMedium and PUxHigh — land at p = 0.657 and p = 0.769. Neither is anywhere near significant.
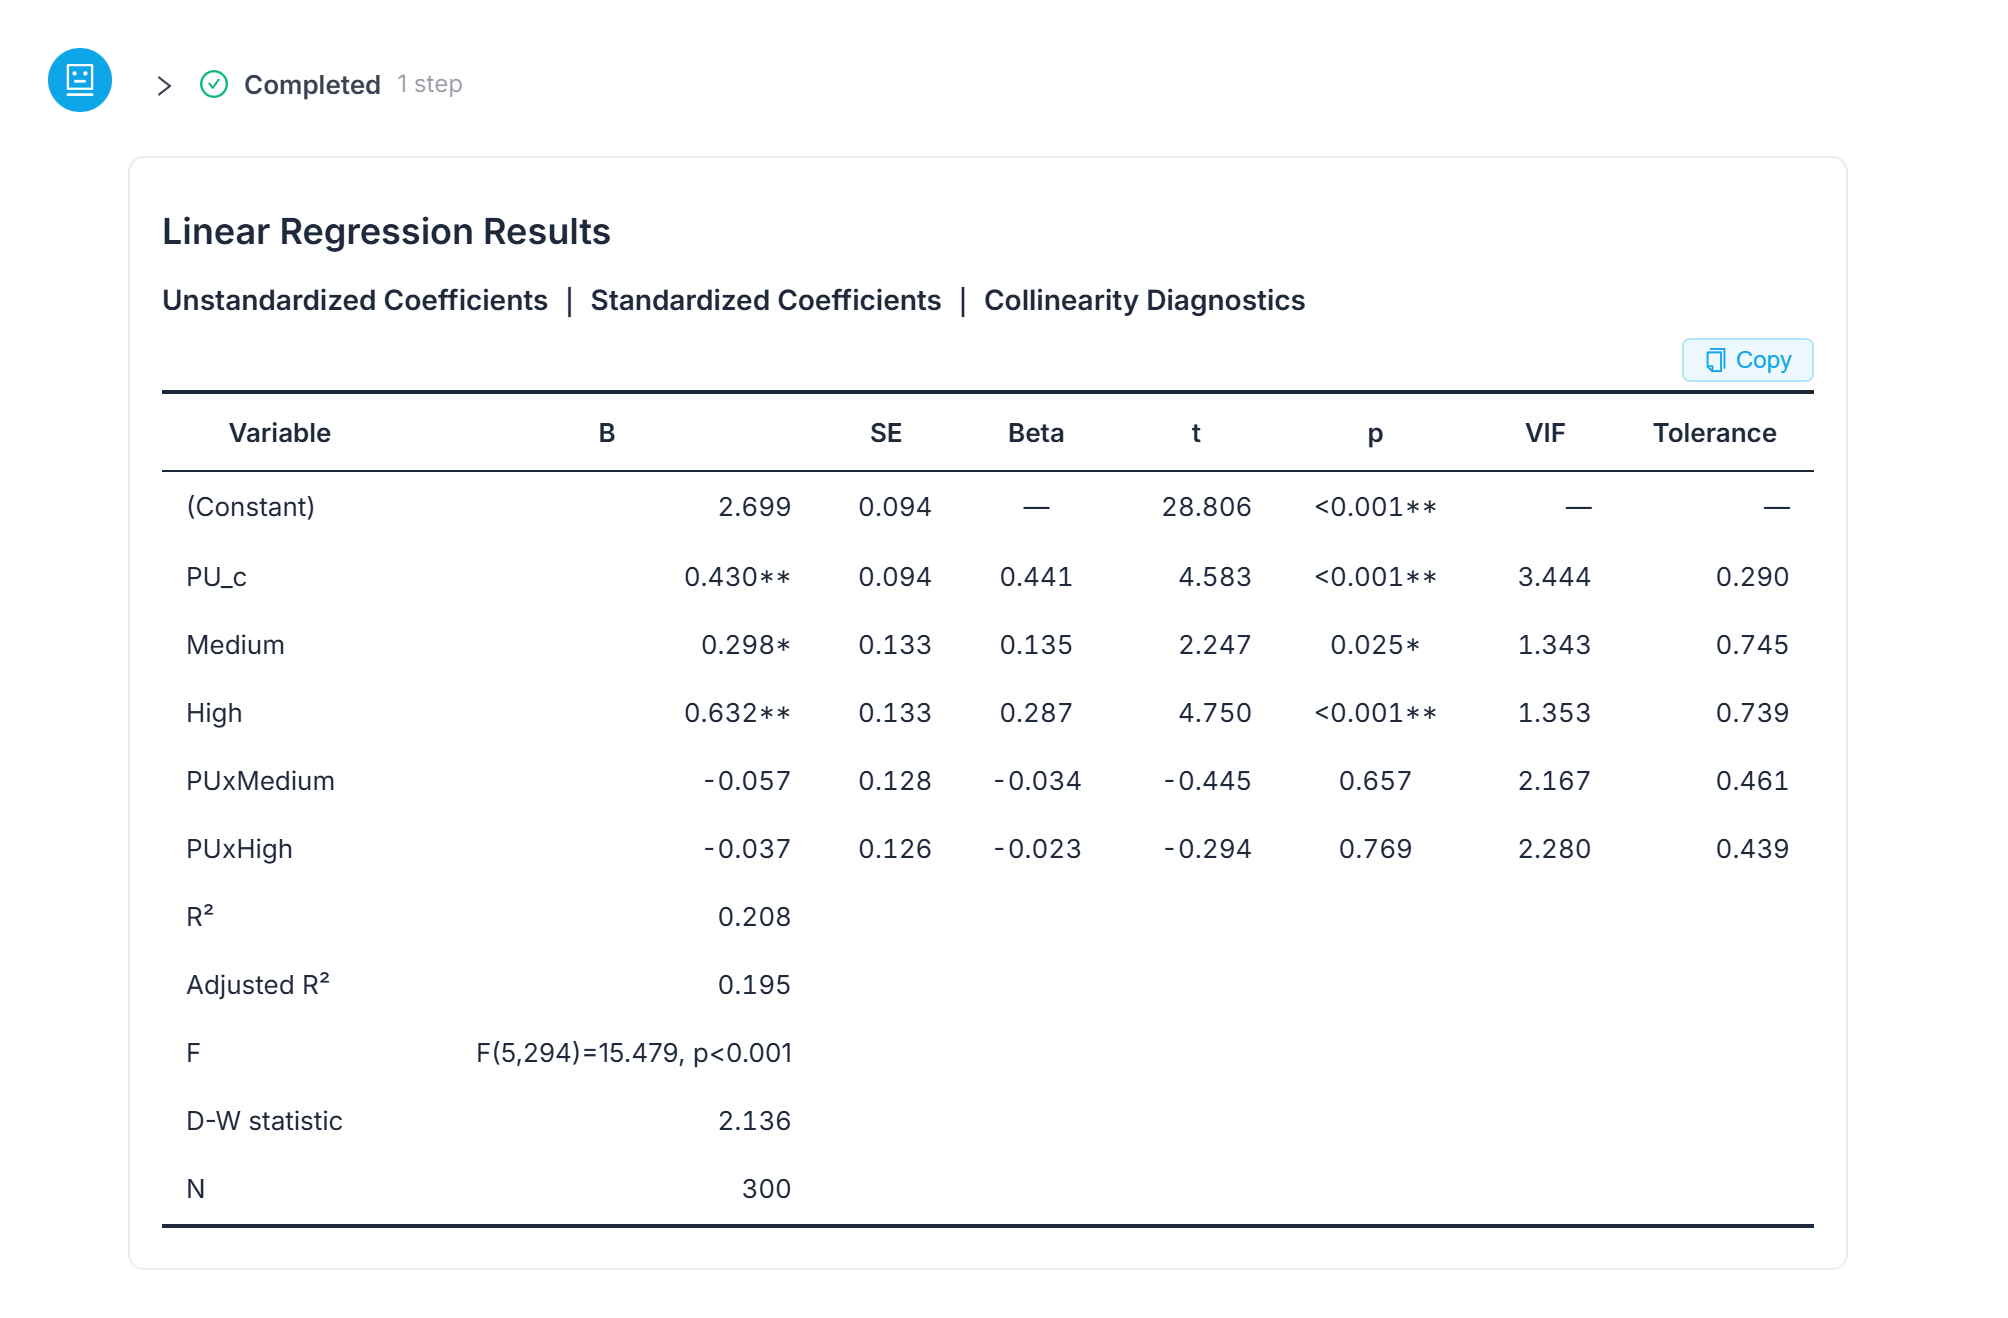 The full model behind the table above — the two interaction rows near the bottom are the ones a moderation write-up actually needs.
It Caught Its Own Detour
Along the way, the model had also produced a plain single-predictor regression of usefulness on intention — a leftover from an earlier step. Rather than let it sit in the output as though it were an answer, it flagged it directly: "The previous single-predictor output was an overall association and does not provide the requested group-specific slopes, so I am not using it for the conclusion. I will now estimate separate usefulness-to-intention regressions within the low-, medium-, and high-usage groups." It discarded its own intermediate result, in writing, before producing the three within-group models the question called for.
 The model naming its own detour before correcting it — the single-predictor output above this message is not used in the conclusion.
What the Slopes Mean, and Whether the Interaction Matters
What those three within-group slopes were, why a non-significant interaction is a perfectly reportable finding, and the one misreading that turns this exact table into a wrong conclusion, is the subject of how to report a non-significant moderation result, which reads this same output line by line. One thing not to do in the meantime: don't shift where the low, medium, and high cutoffs sit just because the interaction came out flat — a cut point chosen after seeing the result is no longer a design decision.
When This Does Not Apply
- Moderation describes statistical relationships, not causes.
- Where you cut the groups, and which one you nominate as the reference, both change how the coefficients read.
- Interaction terms are harder to detect than main effects at modest sample sizes, so a null result is not proof that no moderation exists anywhere in the data.
- Check the model's stated reasoning yourself before trusting the model it picked.
Frequently Asked Questions
Do I need to dummy-code the groups myself before running this?
No. Describe the grouping variable and the two continuous variables in one sentence; the model chooses the reference group and builds both interaction terms on its own, as shown above.
What's the difference between a categorical moderator and a continuous one?
A continuous moderator (age, an attitude score) gets centred and multiplied against the predictor to form one interaction term. A categorical moderator with three or more levels gets dummy-coded against a reference group first, and each dummy variable needs its own interaction term.
Why does a three-group moderator need two interaction terms instead of one?
Each dummy variable (Medium vs. low, High vs. low) compares one group to the reference, and each comparison needs its own interaction term. One term would leave the other group untested.
Should I change the reference group if the results look inconvenient?
No. The reference group is chosen for a substantive reason stated before running the model — here, low usage as the natural baseline — not re-picked based on which comparisons come out significant.
Bottom Line
Running a moderation analysis with a categorical moderator does not require hand-building dummy variables or interaction terms. Describing the variables in one sentence, and letting the model state and justify its own design choice, is the same test run a different way.
Run a moderation analysis with a categorical moderator in ChatSRS — bring your predictor, outcome, and grouping variable; no manual dummy coding required.