Academic Reporting ·
How to Report a Moderation Analysis When the Interaction Isn't Significant
How to report a moderation analysis when the interaction term isn't significant: read the right row, tell a group difference apart from moderation, and write up a null interaction as a real, reportable finding. Demo data, N = 300.
How to report moderation analysis results when the interaction term is not significant: state plainly that the relationship's strength did not differ across groups — that is a real, reportable finding, not a failed test, and it is a different claim from the group main effects, which test something else entirely.
What This Guide Covers
This is the results-reading companion to running a moderation analysis with a categorical moderator — same simulated survey data (N = 300), same low-, medium-, and high-usage groups of 100 each, same six-row model. Here is how that table gets misread: scan down, see the usage-group rows are significant, and relax — the groups differ, so the moderation must have worked. Then an advisor says the hypothesis was not supported, with no obvious clue which part went wrong.
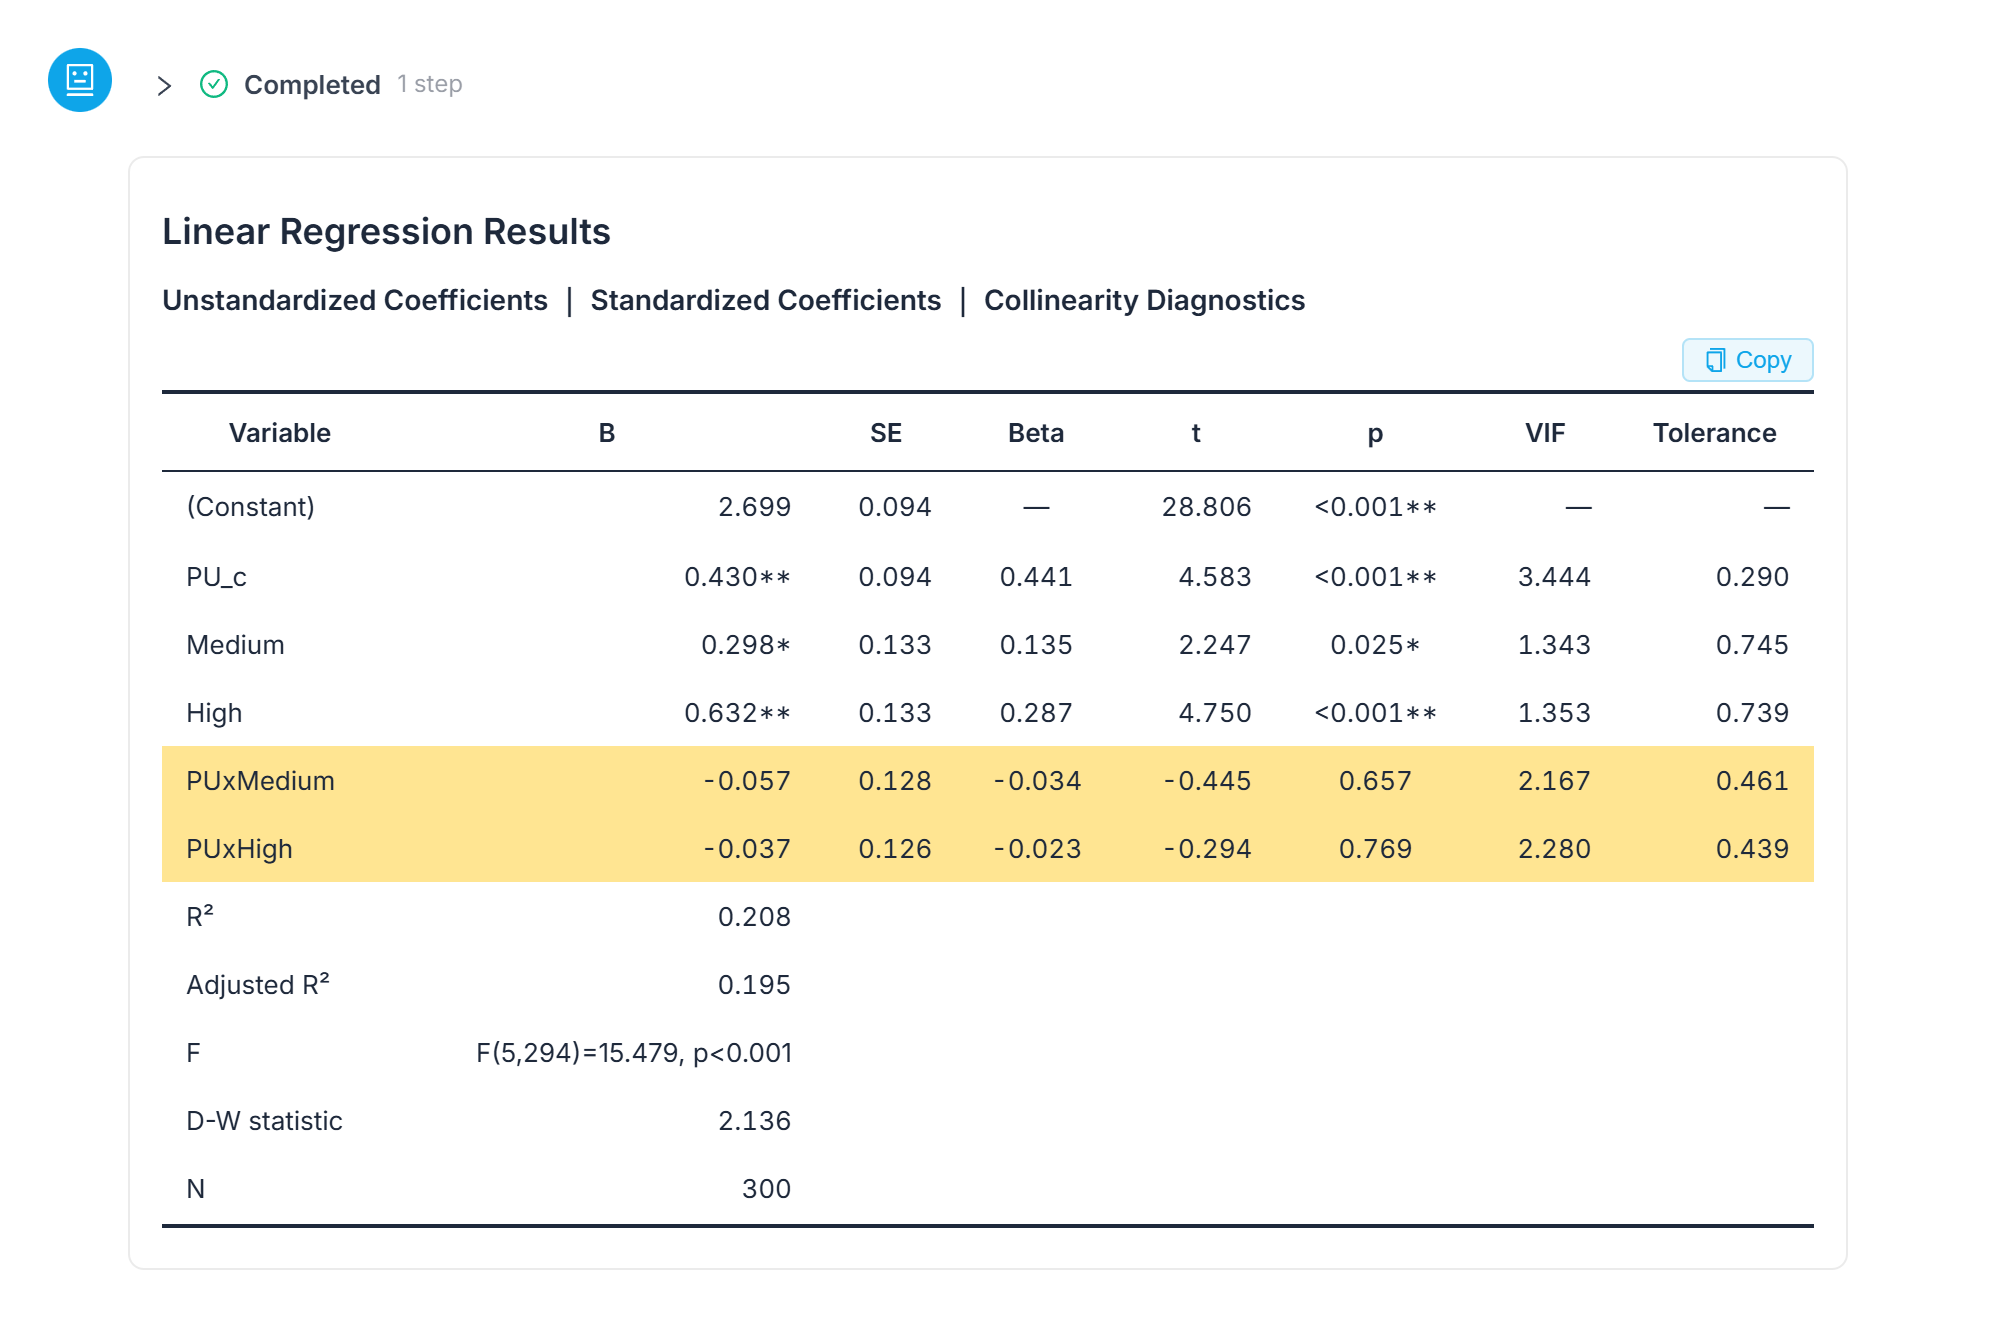 The full model — constant, PU_c, Medium, High, and both interaction terms — with the two rows that actually test moderation highlighted.
Know Which Row Your Hypothesis Lives On
The model has six rows: the constant; PU_c, perceived usefulness centred; Medium and High, the two dummy variables comparing each usage group against low use; and PUxMedium and PUxHigh, the two interaction terms. Only those last two rows test moderation. Everything above them tests something else.
| Row | B | p | What it tests |
|---|---|---|---|
| PU_c (perceived usefulness, centred) | 0.430 | < 0.001 | Whether usefulness predicts intention at all |
| Medium (vs. low use) | 0.298 | 0.025 | Whether medium-use students report different intention than low-use students |
| High (vs. low use) | 0.632 | < 0.001 | Whether high-use students report different intention than low-use students |
| PU_c × Medium | -0.057 | 0.657 | Whether the usefulness-to-intention slope differs for medium- vs. low-use students |
| PU_c × High | -0.037 | 0.769 | Whether the usefulness-to-intention slope differs for high- vs. low-use students |
Source: ChatSRS moderation analysis output on simulated survey data, N = 300, three usage-frequency groups of 100 each. Model: F(5, 294) = 15.479, p < 0.001, R² = 0.208, adjusted R² = 0.195.
The Other Rows Are Genuinely Strong — and That Is the Trap
PU_c, Medium, and High are all significant — the heavier-usage groups do report higher intention. ChatSRS's own interpretation states it plainly: "At average perceived usefulness, medium- and high-use students nevertheless reported higher behavioral intention than low-use students (B = 0.298, p = .025 and B = 0.632, p < .001, respectively)." Three significant rows in a row. None of them is the moderation hypothesis.
The Two Rows That Decide It
The product's verdict on the two that actually matter: "Relative to this low-use slope, neither the medium-use interaction (B = -0.057, p = .657) nor the high-use interaction (B = -0.037, p = .769) was significant; the evidence therefore does not support moderation by usage frequency."
 The model's own interpretation text — the source for both quotations above.
Run the Groups Separately and the Relationship Holds in All Three
| Usage group | Simple slope (B) | Standardized effect | p | R² |
|---|---|---|---|---|
| Low | 0.430 | .418 | < .001 | .175 |
| Medium | 0.373 | .390 | < .001 | .152 |
| High | 0.393 | .435 | < .001 | .190 |
Source: ChatSRS within-group regression output on simulated survey data, N = 300 (100 per usage group).
A simple slope answers a plain question — one point more perceived usefulness buys how much more intention? — and the answer is roughly the same in all three groups. ChatSRS's own conclusion: "...the strength of the perceived-usefulness effect did not differ reliably between low-, medium-, and high-frequency users."
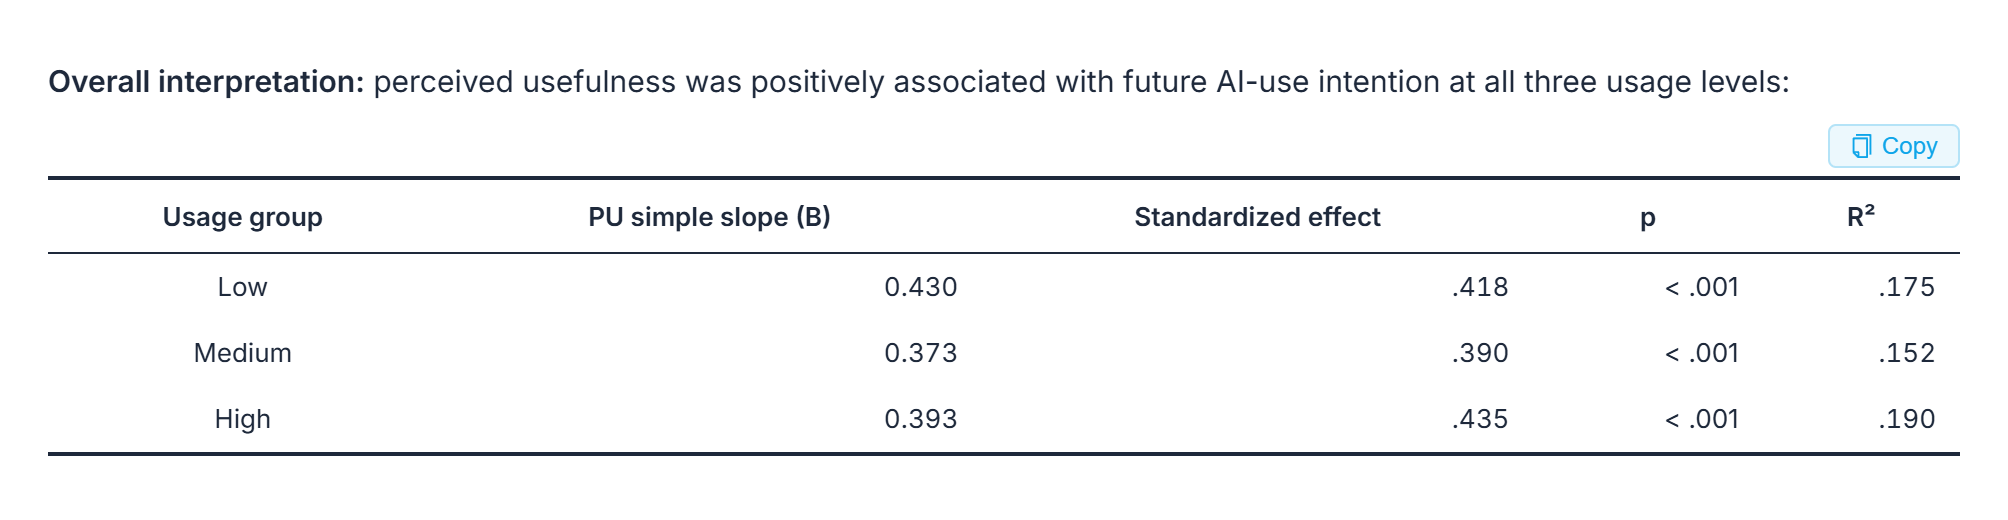 The three within-group slopes side by side — every figure in the table above is visible here.
Moderation Is About Slopes, Group Differences Are About Intercepts
What differs here is the starting point, not the slope. Heavy users report higher intention across the board — that is what the Medium and High rows measure, and it is real. But how much their intention responds to finding AI useful is the same as everyone else's. Moderation is a question about slopes. Group differences are a question about intercepts. Confuse the two and a group gap gets reported as an interaction — the error that makes an advisor stop reading.
That slope-versus-intercept question also differs from mediation, which asks whether a third variable explains why X relates to Y, not whether the relationship's strength changes by group. If that is the question being asked, see the mediation walkthrough instead.
 The closing verdict — both interaction terms restated, and the slope held stable across groups.
Can I Just Adjust the Data Until the Interaction Is Significant?
No — this deserves a direct answer, because one version of it looks like a modelling choice rather than misconduct. Dropping awkward respondents or editing responses is an obvious violation. The tempting one here is sliding the low/medium/high cut points around and re-running until an interaction term finally clears .05. Moving the boundaries until the p-value cooperates is the same act as changing the data — it just has better cover.
What to do instead: check you are reading the right row (a lot of "my moderation worked" turns out to be a main effect, not an interaction); revisit the hypothesis if the reasoning for expecting a group difference was thin, since a null interaction may simply be the expected result; and if a real pattern by group exists in the baseline (as it does here — heavier users start higher regardless of usefulness), treat that as a different model rather than a rescue of this one. Then report the null interaction as a finding, not a failure — the effect of perceived usefulness on intention was stable across usage-frequency groups is a real result. Hiding it is the only actual problem.
When This Does Not Apply
- How you cut the groups, and which one you nominate as the reference, both change how the coefficients read.
- Interaction terms need more statistical power than main effects, so a modest sample can miss a real one.
- Moderation describes statistical relationships, not causes.
- Where the .05 line sits varies by field — confirm the expected threshold with an advisor before writing the conclusion.
- Check the model's reasoning yourself rather than taking the verdict on faith.
Frequently Asked Questions
Is a non-significant interaction still worth reporting?
Yes. "The effect of perceived usefulness on intention was stable across usage-frequency groups" is a real, reportable finding — a null interaction is an answer, not an absence of one.
Can I move the low/medium/high cut points until the interaction becomes significant?
No. Sliding the boundaries around and re-running until a p-value clears .05 is the same act as changing the data, just with better cover.
What is the difference between a significant group effect and moderation?
A significant group row (Medium, High) means the groups differ in average outcome — an intercept question. Moderation means the relationship between two other variables changes in strength across groups — a slope question, tested only by the interaction terms. A study can have one without the other.
What is a simple slope, and why do I need one for each group?
A simple slope is the predictor-to-outcome relationship estimated separately within one group — reporting one per group is how a non-significant interaction gets shown to be stable rather than unexamined.
Bottom Line
Reading a moderation result correctly comes down to one habit: find the interaction rows first, read the group and predictor rows second, and never let a significant group difference stand in for a significant interaction. A non-significant interaction is a finding that the relationship holds the same way across groups, and it deserves to be written up as one.
Read your own moderation analysis output in ChatSRS — check which rows actually test your hypothesis, and get an interpretation you can adapt into your results section.