Statistical Tutorial ·
Pearson or Spearman? Who Decides Which Correlation to Run
A walkthrough of correlation analysis in ChatSRS where the coefficient choice was left open on purpose: one skewed variable, a plain-English prompt, and the product's own reasoning for picking Spearman. Demo data, N = 290.
Every intro-stats handout says the same thing about correlation: Pearson's r if your variables are roughly normal, Spearman's rho if they're not. What the handout doesn't say is who checks. In a lot of student write-ups, nobody does — Pearson goes in the methods section by default, because that's the button everyone remembers. Below is a walkthrough where that check was handed over instead of skipped.
What This Walkthrough Covers
This is a walkthrough on demo data — not real thesis data. A simulated survey, N = 290 (the cleaned sample from earlier steps in the same session), covering perceived usefulness, perceived ease of use, social influence, attitude, behavioral intention, and one variable that doesn't behave like the rest: hours per week using AI tools. I uploaded the spreadsheet to ChatSRS and typed one line, deliberately leaving the method choice open.
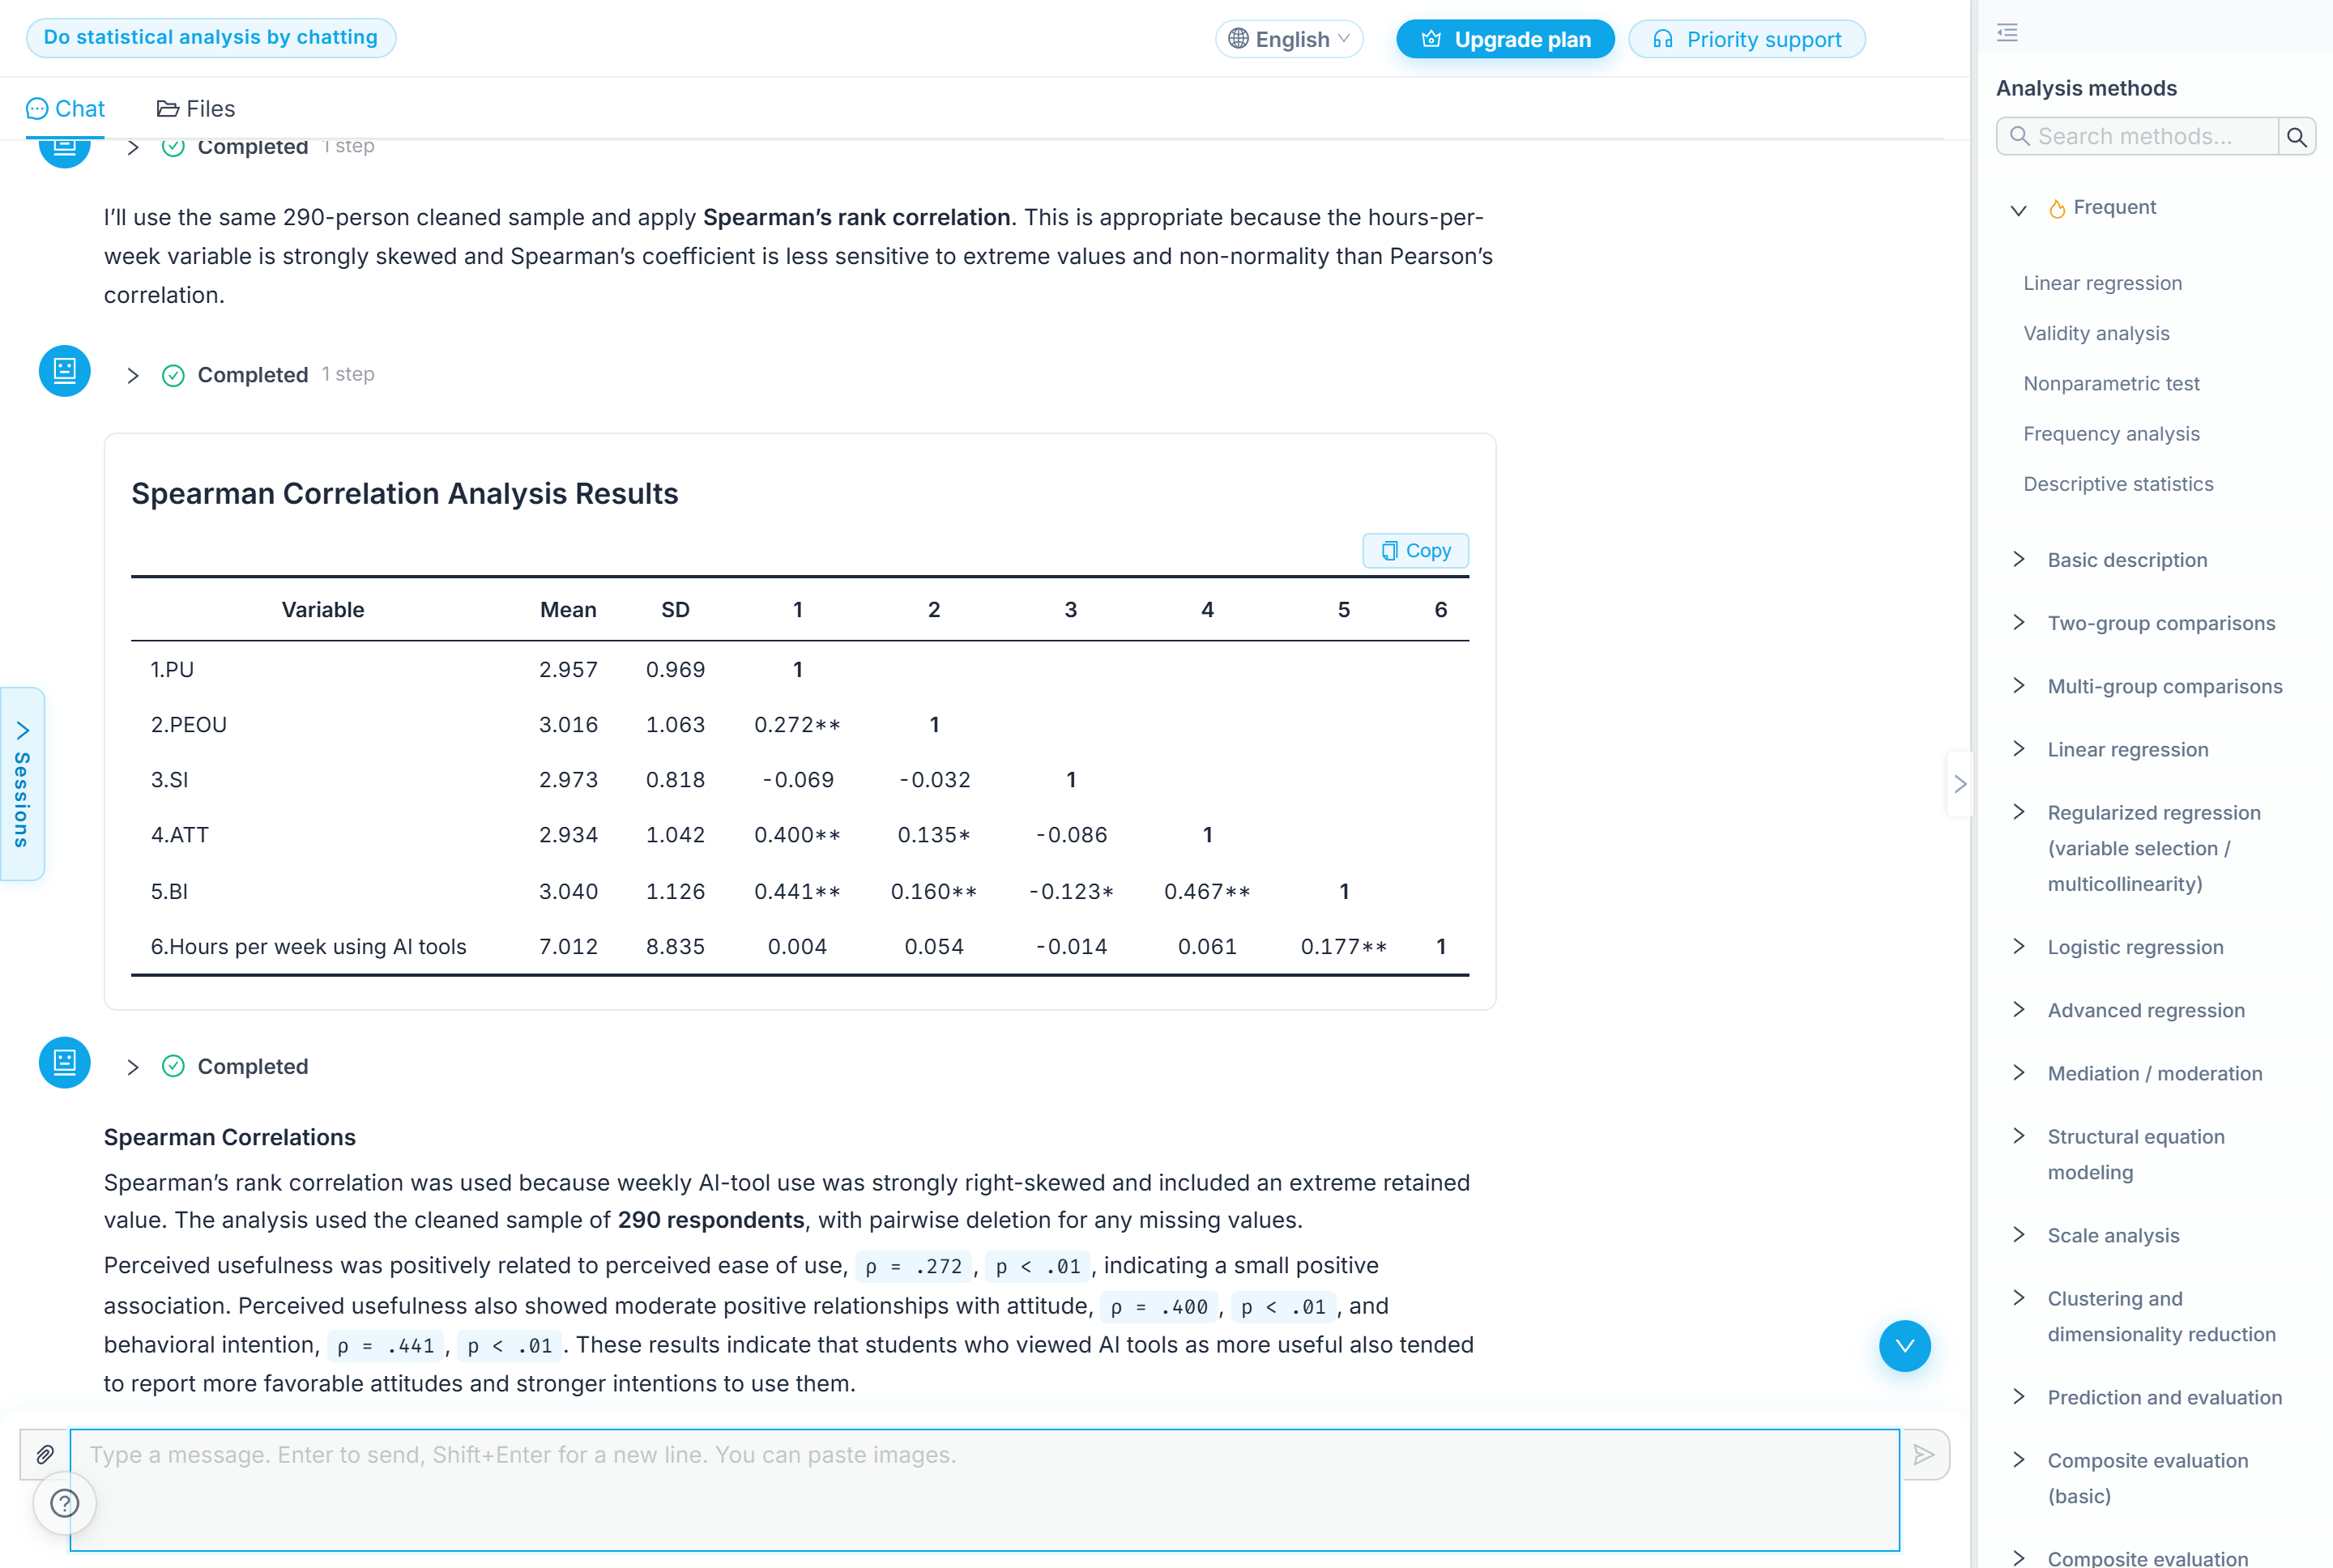 The ChatSRS interface this walkthrough was run in, with the uploaded demo dataset visible before any analysis was requested.
One Prompt, One Judgment Call Left Open
The full prompt: "Run a correlation analysis. Perceived usefulness, perceived ease of use, social influence, attitude, behavioral intention, and hours per week using AI tools - how do they relate to each other. The hours variable looks quite skewed, so I would like you to decide which correlation coefficient to use." Two things were doing the work in that sentence: naming the six variables, and handing over exactly one judgment call — which coefficient — instead of specifying Pearson or Spearman myself.
It made the call before running anything, and said why: "I'll use the same 290-person cleaned sample and apply Spearman's rank correlation. This is appropriate because the hours-per-week variable is strongly skewed and Spearman's coefficient is less sensitive to extreme values and non-normality than Pearson's correlation." No hedging, no offer to switch back to Pearson if I preferred — a method, stated, with the reason tied to the one variable that forced it.
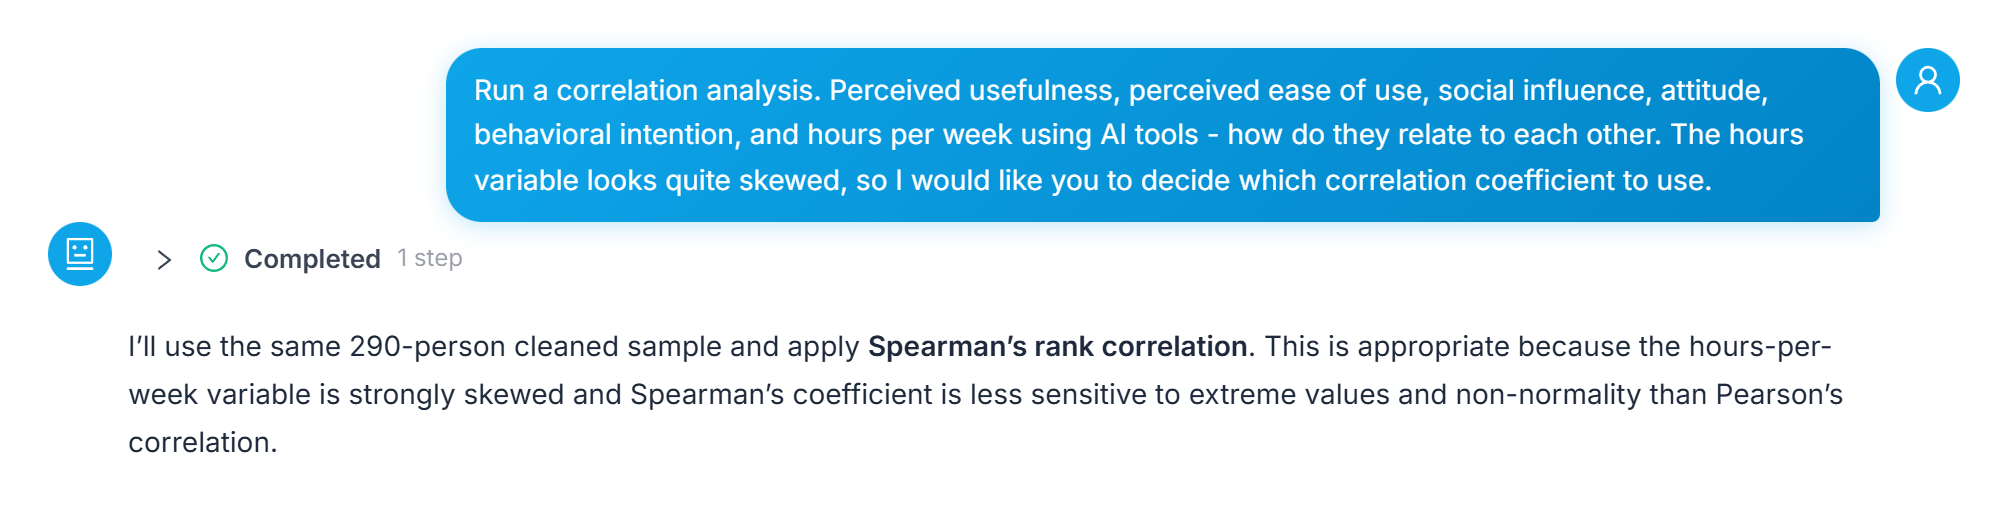 The one-line prompt that started the analysis, and the assistant's reply naming Spearman before running anything.
Reading the Matrix: The Pairs That Held Up
What came back was a full correlation matrix, six variables by six, carrying the mean and SD for each alongside the coefficients. A few of the relationships are easy to read at a glance.
| Pair | Spearman ρ | Significance |
|---|---|---|
| Attitude ↔ Behavioral intention | .467 | p < .01 |
| Perceived usefulness ↔ Behavioral intention | .441 | p < .01 |
| Perceived usefulness ↔ Attitude | .400 | p < .01 |
| Perceived usefulness ↔ Perceived ease of use | .272 | p < .01 |
| Hours per week ↔ Behavioral intention | .177 | p < .01 |
Source: ChatSRS Spearman correlation output on simulated survey data, N = 290 (demo data, not real thesis data).
Attitude and behavioral intention are the strongest pair in the table. Hours per week — the variable that started this whole decision — turns out to relate to almost nothing else in the matrix except behavioral intention, at ρ = .177, p < .01.
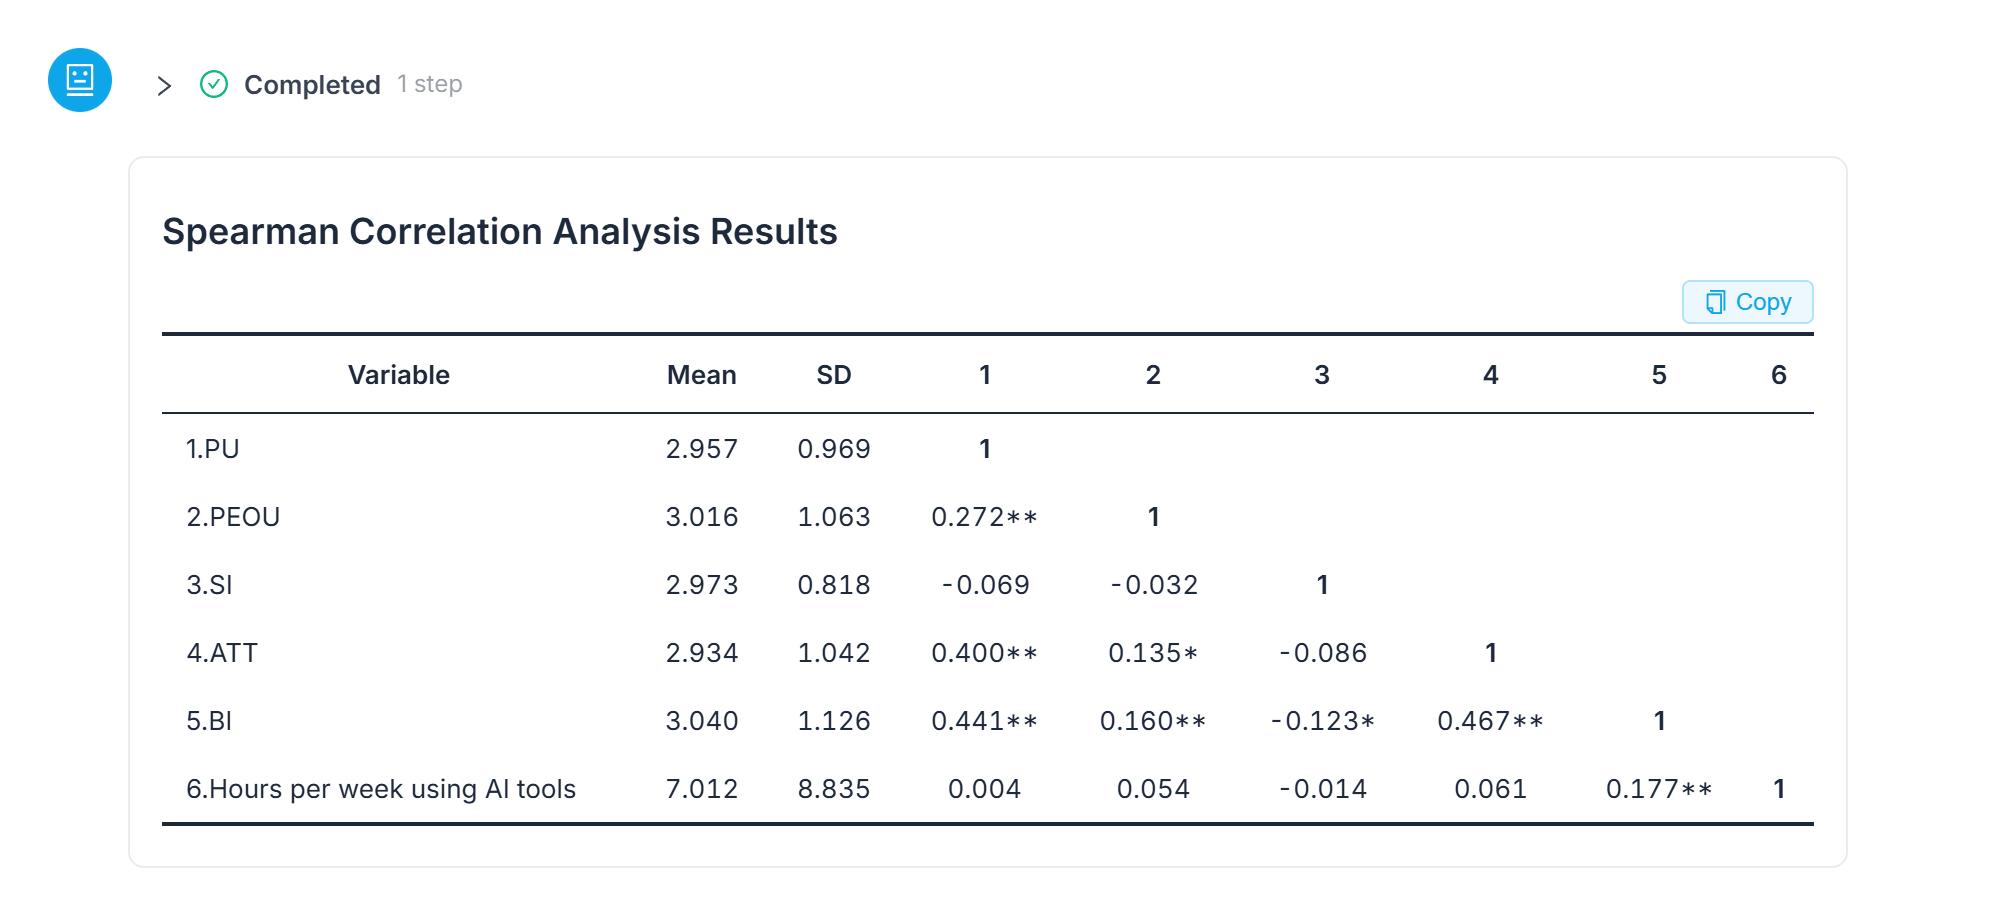 The full "Spearman Correlation Analysis Results" table, six variables by six, with significance markers on each cell.
Why Spearman? In the Product's Own Words
The write-up paragraph that explains why the whole table is Spearman and not Pearson: "Spearman's rank correlation was used because weekly AI-tool use was strongly right-skewed and included an extreme retained value. The analysis used the cleaned sample of 290 respondents, with pairwise deletion for any missing values." That's the method note a results section needs, in two sentences, written around the one variable that made it necessary rather than as a generic disclaimer.
 The product's own method note: why Spearman, and the sample it ran on.
One Row Worth Flagging, Not Explaining
Social influence barely correlates with anything else in the table, and the one relationship that does clear significance runs negative. That number is real, but it deserves a careful reading rather than a quick explanation — more on that, and on writing up a row that comes back mostly null, in how to report correlation results when a row isn't significant.
What This Walkthrough Doesn't Cover
- Reading and reporting a mostly non-significant row, including the one cell that is significant and negative — that's covered in how to report correlation results in APA 7.
- Testing whether these variables still relate to each other once you control for the rest of them at once, rather than pairwise, is a different question — see how to run multiple regression online.
- Correlation describes two variables moving together, not one causing the other, and a rank-based coefficient like Spearman tells you about the order of scores, not the size of the raw difference between them. Check the AI's reasoning yourself before a coefficient becomes a sentence in your results chapter.
Frequently Asked Questions
How do you decide between Pearson and Spearman?
Check whether the variables involved are roughly normally distributed and free of extreme values. In this walkthrough, one variable — hours per week using AI tools — was flagged as skewed in the prompt itself, and ChatSRS picked Spearman's rank correlation because it is less sensitive to extreme values and non-normality than Pearson's correlation.
Do I have to name the correlation method myself, or can I leave it open?
In this walkthrough it was left open on purpose. The prompt named the six variables and stated the fact that one looked skewed, without naming Pearson or Spearman. ChatSRS made the method decision and stated its reason before running anything.
What does "less sensitive to extreme values" actually mean?
Spearman's rank correlation works on the order of scores rather than their raw values, so a single extreme data point doesn't pull the coefficient the way it can with Pearson's r, which uses the raw values directly.
What if one of the variables in the matrix barely correlates with anything?
That's not an error — it's a normal result, and how to read and report a mostly non-significant row (including one cell that is significant) is covered in reporting correlation results in APA 7.
Can correlation tell me which variable is driving the relationship?
No. Correlation describes two variables moving together, not causation, and it doesn't control for the other variables in the dataset the way multiple regression does. See how to run multiple regression online if that's what you need next.
Bottom Line
Choosing between Pearson and Spearman doesn't require memorizing a flowchart — naming the variables and stating what you already know about their distribution, in one plain-English sentence, is enough to get a method decision with a reason attached to it.
Run your own correlation analysis in ChatSRS — describe your variables and any known distribution issues, and get a coefficient choice with the reasoning shown.