Academic Reporting ·
How to Report Correlation Results in APA 7 When a Row Isn't Significant
How to read and report a Spearman correlation matrix in APA 7 when one whole row comes back mostly non-significant, including the one small negative cell that does clear .05. Demo data, N = 290.
A row of non-significant correlations isn't a broken variable — it means that construct didn't move together with the others in this sample, and the honest move is to report every cell exactly as it came back, including the one that is significant, negative, and small. Below is a full worked example.
What This Guide Covers
This is the reporting companion to Pearson or Spearman: who decides which correlation to run — same simulated survey data (N = 290), same six variables (perceived usefulness, perceived ease of use, social influence, attitude, behavioral intention, and hours per week using AI tools), same Spearman correlation matrix, because that page already covers why Spearman was the right call for this data. This one covers what to do once one whole row of that matrix comes back mostly above .05.
Demo data throughout — a simulated survey, N = 290, not real thesis data.
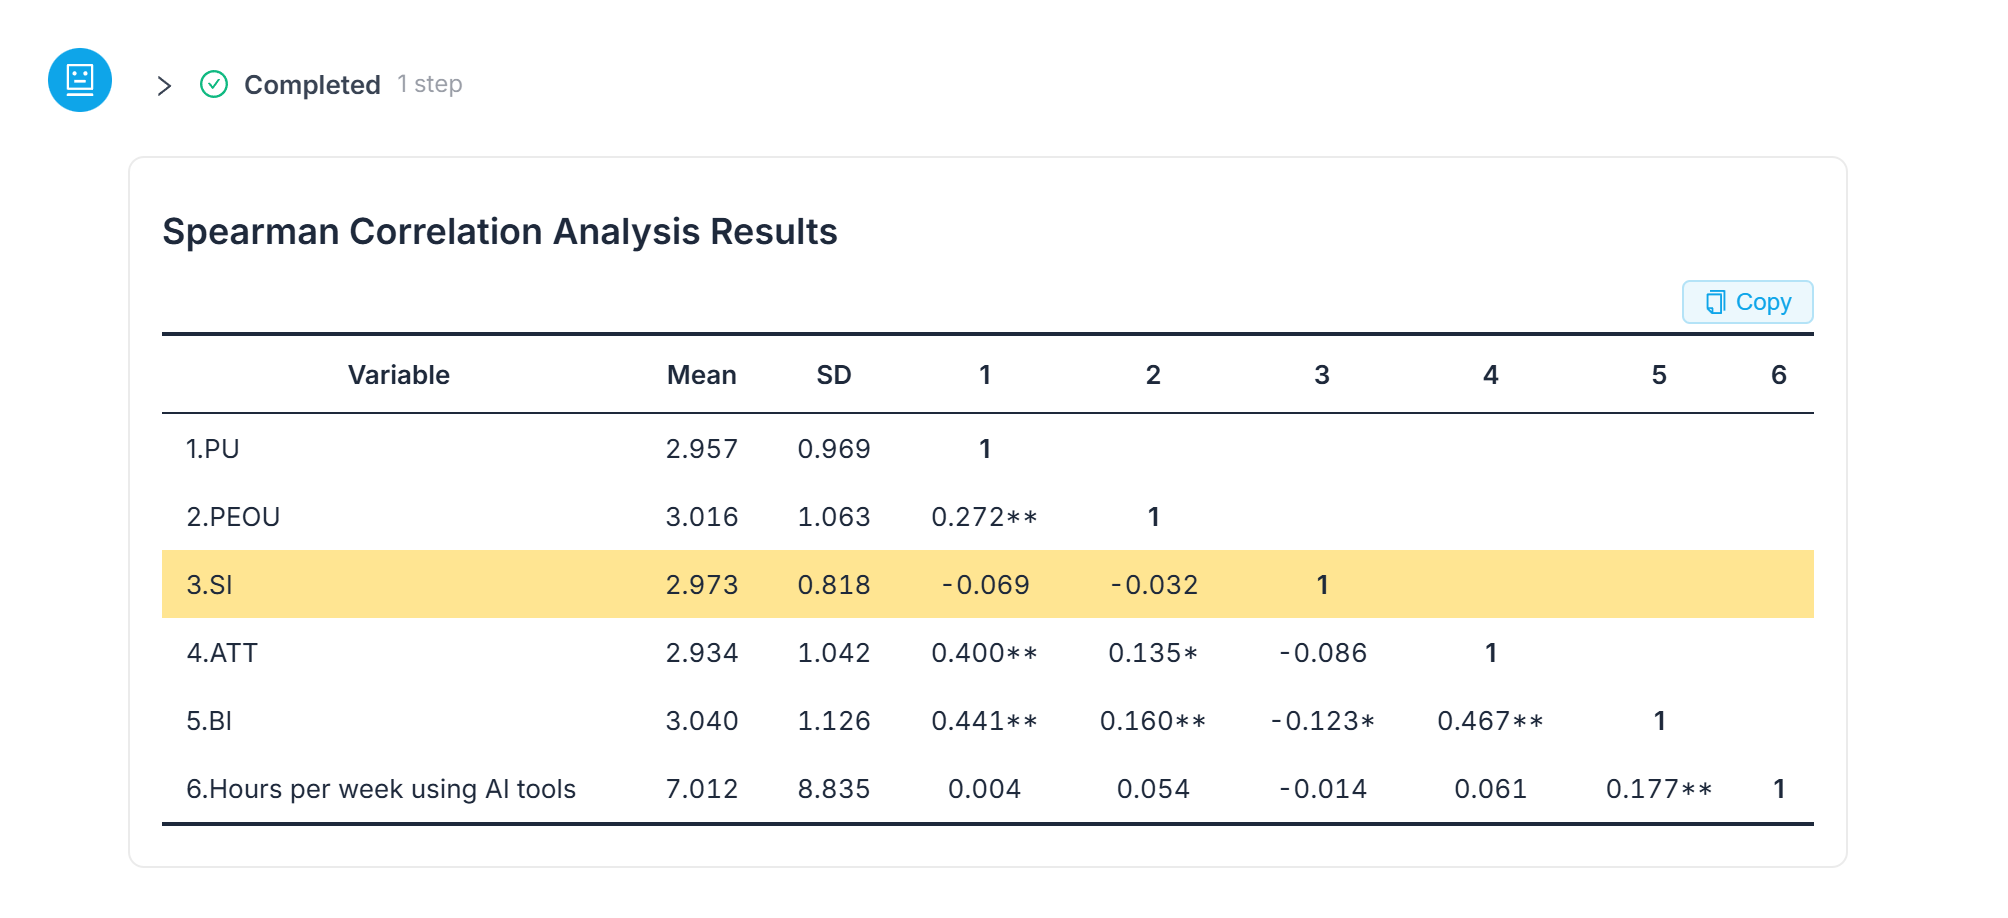 The same correlation matrix from the companion walkthrough, with the social influence row highlighted.
Start With the Rest of the Matrix, Not the Row in Question
Most of the table reads the way a correlation table is supposed to. Attitude and behavioral intention correlate at ρ = .467, p < .01. Perceived usefulness correlates with behavioral intention at ρ = .441 and with attitude at ρ = .400, both p < .01. Perceived ease of use is more weakly related to attitude, ρ = .135, p < .05, and to behavioral intention, ρ = .160, p < .01.
| Pair | Spearman ρ | Significance |
|---|---|---|
| Attitude ↔ Behavioral intention | .467 | p < .01 |
| Perceived usefulness ↔ Behavioral intention | .441 | p < .01 |
| Perceived usefulness ↔ Attitude | .400 | p < .01 |
| Perceived ease of use ↔ Attitude | .135 | p < .05 |
| Perceived ease of use ↔ Behavioral intention | .160 | p < .01 |
Source: ChatSRS Spearman correlation output on simulated survey data, N = 290 (demo data, not real thesis data).
So the method isn't the problem — four of the five psychological constructs line up with each other roughly the way the underlying theory predicts. That's worth establishing before you look at the row that doesn't.
Read the Social Influence Row on Its Own Terms
ChatSRS's own read of the row: "Social influence was not significantly related to perceived usefulness, perceived ease of use, or attitude." Three relationships, three non-significant results — in the table those cells read -0.069, -0.032 and -0.086: numbers close enough to zero that there is nothing there to interpret.
The One Cell That Is Significant — Handle It Carefully
The row isn't entirely flat, though, and that one cell is the one to be careful with: "It was weakly negatively related to behavioral intention, ρ = -.123, p < .05, although the effect was small. This negative direction should be interpreted cautiously and may reflect sample-specific response patterns rather than a substantive general relationship." Read that twice before you write anything about it. The product found one significant cell in a row of otherwise-null ones and did the opposite of what most write-ups do when a stray significant result shows up — it didn't build a story around it. It called the effect small, named the direction as unexpected, and flagged its own result as something to be cautious with rather than something to explain.
 The product's own paragraph-by-paragraph read of the social influence row, including the caution about the negative sign.
How to Report a Row Like This
Three things worth doing. First, report every cell, not just the ones that clear .05 — a correlation table that only shows significant pairs isn't reporting the analysis you ran. Second, write the non-significant cells as an absence of evidence for a relationship, not evidence that no relationship could exist; a 290-person cross-sectional survey isn't built to rule things out completely. Third, treat the one significant, negative, small cell exactly the way the product treated it: named, reported, and explicitly held apart from any conclusion about how social influence actually works. In APA terms, that sequence is the whole write-up — name the method and sample, report the significant pairs with direction and coefficient, report the non-significant pairs plainly, and close with the causal caveat. If you also need the full APA sequence for a regression table in the same thesis — B, SE, Beta, t, p, VIF, and tolerance — that's covered separately in how to report regression in APA 7, and the same logic for a non-significant result applies on the regression side in reading and reporting a non-significant predictor.
When Does This Not Apply
Spearman's rho, like Pearson's r, describes two variables moving together, not one causing another — a coefficient this close to zero says social influence and the other four constructs simply don't track each other in this sample, which is not the same claim as social influence does not matter in general. Where to draw the line between reporting a null result plainly and over-interpreting an isolated significant one is a judgment call your advisor will have opinions about. And check the AI's reasoning yourself before a mostly-null row becomes a paragraph in your thesis.
Frequently Asked Questions
Does a non-significant correlation mean there's no relationship at all?
No. It means this sample gave no evidence of one. A 290-person cross-sectional survey isn't built to rule out a relationship completely — write the non-significant cells as an absence of evidence, not proof that no relationship could exist.
Should I still report the correlations that aren't significant?
Yes. A correlation table that only shows the significant pairs isn't reporting the analysis you ran. In this example, three of the four cells in the social influence row were non-significant, and all three were reported alongside the one that wasn't.
The one significant cell in the row is negative — what do I make of that?
Treat it the way the product did: name it, report the coefficient and p value, call the effect small, and explicitly note that the direction should be interpreted cautiously rather than built into a conclusion about how the variable behaves in general.
Is a small but significant correlation still worth reporting?
Yes, but keep "significant" and "small" as two separate statements. Here, ρ = -.123, p < .05, was reported as exactly that — statistically significant and small — not rounded up into a stronger claim.
Bottom Line
Reading a mostly non-significant row is a two-step check — confirm the rest of the matrix behaves the way theory predicts, then read the flat row on its own terms — and reporting it is mostly writing the careful sentence about the one cell that isn't flat, not building a story around it.
Read your own correlation matrix in ChatSRS — get the coefficients, the significance markers, and wording you can adapt for a row that comes back mostly non-significant.