Academic Reporting ·
Chi-Square Significant but the Effect Size Is Small? Here's How to Report Both
A significant chi-square with Cramér's V = 0.232 is not a contradiction — it is two separate findings. A worked example of reading one real output line by line and writing significance, strength, direction, and the assumption check in the right order. Demo data, N = 290.
When a chi-square comes back significant and the effect size comes back small, nothing has gone wrong: the two numbers answer different questions and both belong in the results paragraph. Write them in order — significance, then strength, then direction, then the assumption check. Below is one real output read line by line, on demo data (N = 290).
What This Guide Covers
Most people read a chi-square output for one number and stop. The output has three parts, and they answer three different questions: whether the distributions differ, by how much, and whether the test was entitled to run in the first place. This is the results-reading companion to running a chi-square test online — same simulated survey, same 290-respondent sample, same two variables. That page covers getting the three outputs; this one covers the order to write them in.
The run behind it is demo data — not real thesis data. A simulated survey, uploaded as mock-data-b3-en.xlsx, 310 submissions, cleaned down to a working sample of 290 respondents. Two variables: major, in five categories, against usage-frequency group: low, medium, high.
Step 1: Start With the Crosstab, Not the Verdict
The first card is the crosstab, counts with column percentages in every cell.
| Major | High | Low | Medium | Row total |
|---|---|---|---|---|
| Arts & Design | 3(3.12%) | 13(14.13%) | 9(8.82%) | 25 |
| Business & Economics | 29(30.21%) | 20(21.74%) | 27(26.47%) | 76 |
| Health Sciences | 9(9.38%) | 13(14.13%) | 21(20.59%) | 43 |
| Humanities & Social Sciences | 16(16.67%) | 32(34.78%) | 21(20.59%) | 69 |
| STEM | 39(40.62%) | 14(15.22%) | 24(23.53%) | 77 |
Source: ChatSRS "Chi-square Test Results" output on simulated survey data, N = 290 (demo data, not real thesis data). Column variable: UsageFrequencyGroup. The right edge of the same table carries the test statistic: χ² 31.258, p <0.001**.
STEM is 39(40.62%) of the high-frequency group and 14(15.22%) of the low. Arts & Design runs the opposite way, 3(3.12%) high against 13(14.13%) low. Humanities & Social Sciences takes 32(34.78%) of the low group.
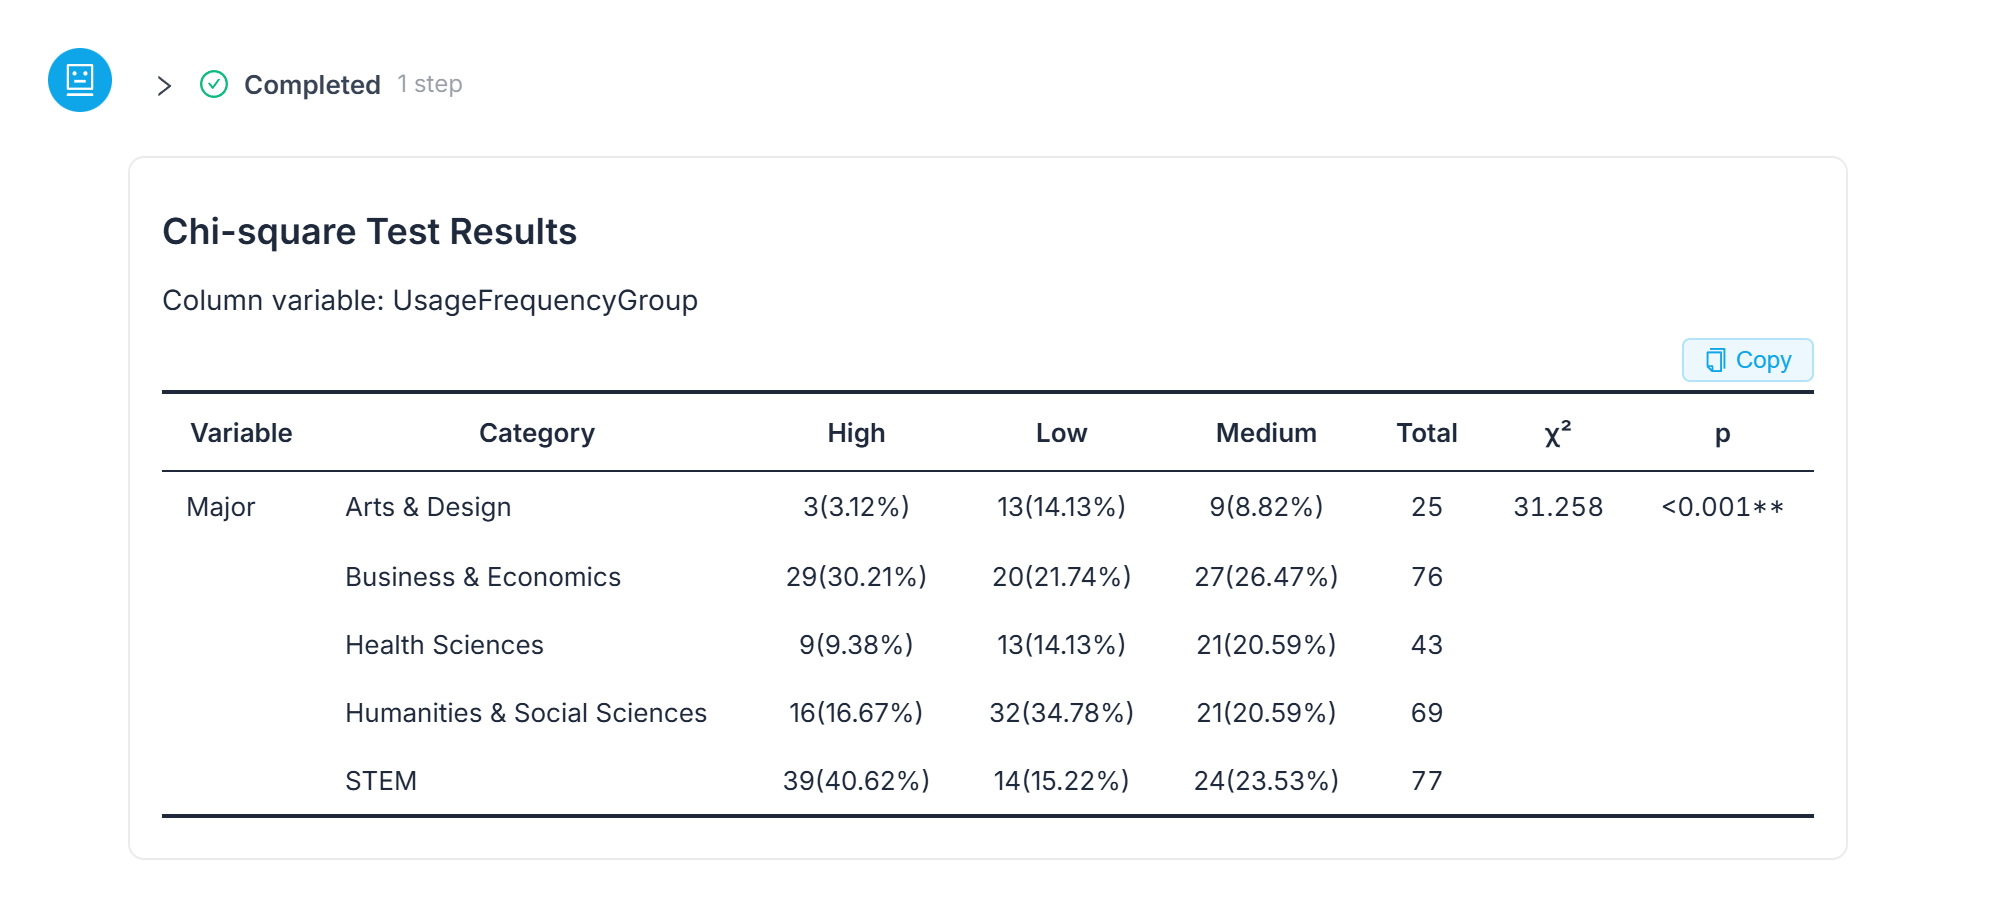 The crosstab in full — the quoted cells sit alongside the other eleven, so a reader can check them rather than take them on trust.
Step 2: The Verdict Sentence, in the Order a Results Section Wants It
The verdict comes back as a sentence, not a number: "There was a statistically significant association between major and usage-frequency group, χ²(8) = 31.258, p < .001. Thus, usage-frequency group distributions differ across majors." Degrees of freedom, statistic, p-value, claim — in exactly that order.
That sentence is complete as a statement of significance and incomplete as a finding. It does not say how large the association is, and it does not say which way it runs.
Step 3: Strength Is a Separate Number — and Small Is Still Reportable
Significant is not the same as large, and the next line supplies size: "The relationship strength was Cramér's V = 0.232, indicating a small-to-moderate association."
This is where write-ups go wrong in both directions. A small Cramér's V does not cancel a significant chi-square, and a significant chi-square does not upgrade a small V. Report both, in that order, and let the size number do its job: it is the sentence that stops a reader assuming the association is large because the p-value was tiny.
Direction is a third thing again, and it comes from the percentages rather than from the test — "The pattern is most apparent for STEM students, who make up 40.62% of the high-frequency group but only 15.22% of the low-frequency group. Humanities & Social Sciences students are more represented in the low-frequency group, whereas Health Sciences students are more represented in the medium-frequency group."
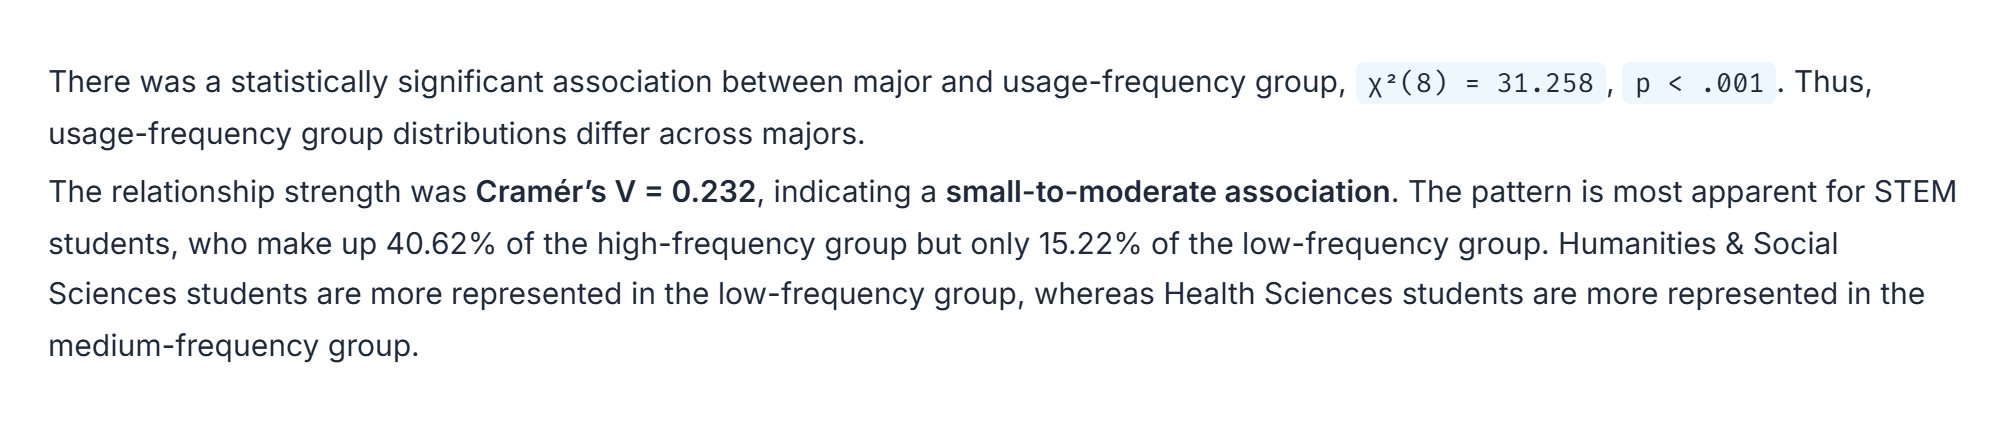 Significance and strength arriving as two separate outputs in one frame — which is the point: the p-value was never the whole answer.
Step 4: The Assumption Check Decides Whether Any of It Is Reportable
Then the part that decides whether the three sentences above are usable at all, printed as two flat lines: "Minimum expected count: 7.93" and "Cells with expected counts below 5: 0 of 15". A chi-square is an approximation, and the approximation degrades when cells are too thin. With nothing under 5, it holds: "Therefore, the chi-square approximation is appropriate, and there is no expected-frequency concern undermining the result."
| Order in your paragraph | What to state | This run |
|---|---|---|
| 1 | The test result | χ²(8) = 31.258, p < .001 |
| 2 | The strength, as its own number | Cramér's V = 0.232, small-to-moderate |
| 3 | The direction, read from the percentages | 40.62% of the high-frequency group is STEM against 15.22% of the low |
| 4 | The assumption check | Minimum expected count 7.93; 0 of 15 cells below 5 |
Source: ChatSRS chi-square output, N = 290 (demo data, not real thesis data). The four rows are the four outputs the run printed, arranged in reporting order.
 The two diagnostic lines and the two sentences that follow them — one for the results section, one for the limitations section.
The Sentence That Belongs in Limitations, Not Results
One sentence belongs in your limitations paragraph rather than your results paragraph, and the product wrote it itself: "The finding indicates an association, not a causal effect of major on AI-use frequency." A crosstab cannot tell you why the distributions differ. Check the AI's reasoning yourself before any of this becomes a sentence in your thesis.
Three numbers, three jobs: 31.258 says the distributions differ, 0.232 says by how much, 7.93 says you are allowed to report either.
What This Guide Doesn't Cover
- Getting the crosstab, the effect size, and the diagnostics out of one prompt in the first place — that is walked through in how to run a chi-square test online.
- Reporting a comparison of a continuous outcome across groups, where the split-result problem takes a different shape; see one outcome significant, the other not.
- Formatting descriptive tables around a results section in APA 7 style; that is covered in reporting descriptive statistics in APA 7.
- Any claim about why the distributions differ. This is cross-sectional demo data.
Frequently Asked Questions
Is a significant chi-square with a small effect size a contradiction?
No. They answer different questions. The p-value says the distributions differ; Cramér's V says by how much. In this run both were true at once: χ²(8) = 31.258, p < .001, and Cramér's V = 0.232, described by the output as a small-to-moderate association.
Do I still report Cramér's V if it comes out small?
Yes. A small strength number is a finding, not an embarrassment — it is what keeps a reader from inferring a large association from a small p-value. Leaving it out is what makes the paragraph misleading.
Where does direction come from if the test doesn't give it?
From the column percentages in the crosstab. In this run that is the line "STEM students, who make up 40.62% of the high-frequency group but only 15.22% of the low-frequency group" — the test statistic alone would not have told you which way the pattern runs.
Do I need to report the expected counts in the paper?
Report the diagnostic when it is doing work: it is what licenses the p-value. In this run it read "Minimum expected count: 7.93" and "Cells with expected counts below 5: 0 of 15", which is why the output could conclude that the approximation was appropriate.
Can I write that major affects how often students use AI tools?
No. The output's own wording is the safe version: "The finding indicates an association, not a causal effect of major on AI-use frequency."
Bottom Line
A chi-square results paragraph has four moves, not one. State the test, state the strength as its own number, read the direction off the percentages, and name the assumption check that lets you report any of it — a small Cramér's V next to a tiny p-value is two findings, not a problem to explain away.
Read your own chi-square output in ChatSRS — upload a crosstab question and get significance, strength, direction, and the expected-count check in wording you can adapt.