Statistical Tutorial ·
How to Run a Chi-Square Test Online: Crosstab, Cramér's V, and Expected Counts in One Prompt
A full walkthrough of running a chi-square test of independence online in ChatSRS: one plain-English prompt that asks for the crosstab, the effect size, and the expected-count check at the same time. Demo data, N = 290.
To run a chi-square test of independence online without skipping its assumption check, upload your data and name three things in one plain-English sentence: the two categorical variables, the strength of the relationship, and whether the expected counts are large enough. ChatSRS returns all three in one answer. Below is a full walkthrough on demo data (N = 290).
What This Walkthrough Covers
A chi-square test of independence asks whether two categorical variables are related — here, whether a student's major is related to how often they use AI tools. The number people report is the p-value. The thing that decides whether that p-value means anything is a diagnostic printed underneath the table: whether every cell had enough expected observations to justify running the test at all.
This is a walkthrough on demo data — not real thesis data. A simulated survey, uploaded as mock-data-b3-en.xlsx, 310 submissions, cleaned down to a working sample of 290 respondents before any test ran. The two variables are major, in five categories, and usage-frequency group: low, medium, high.
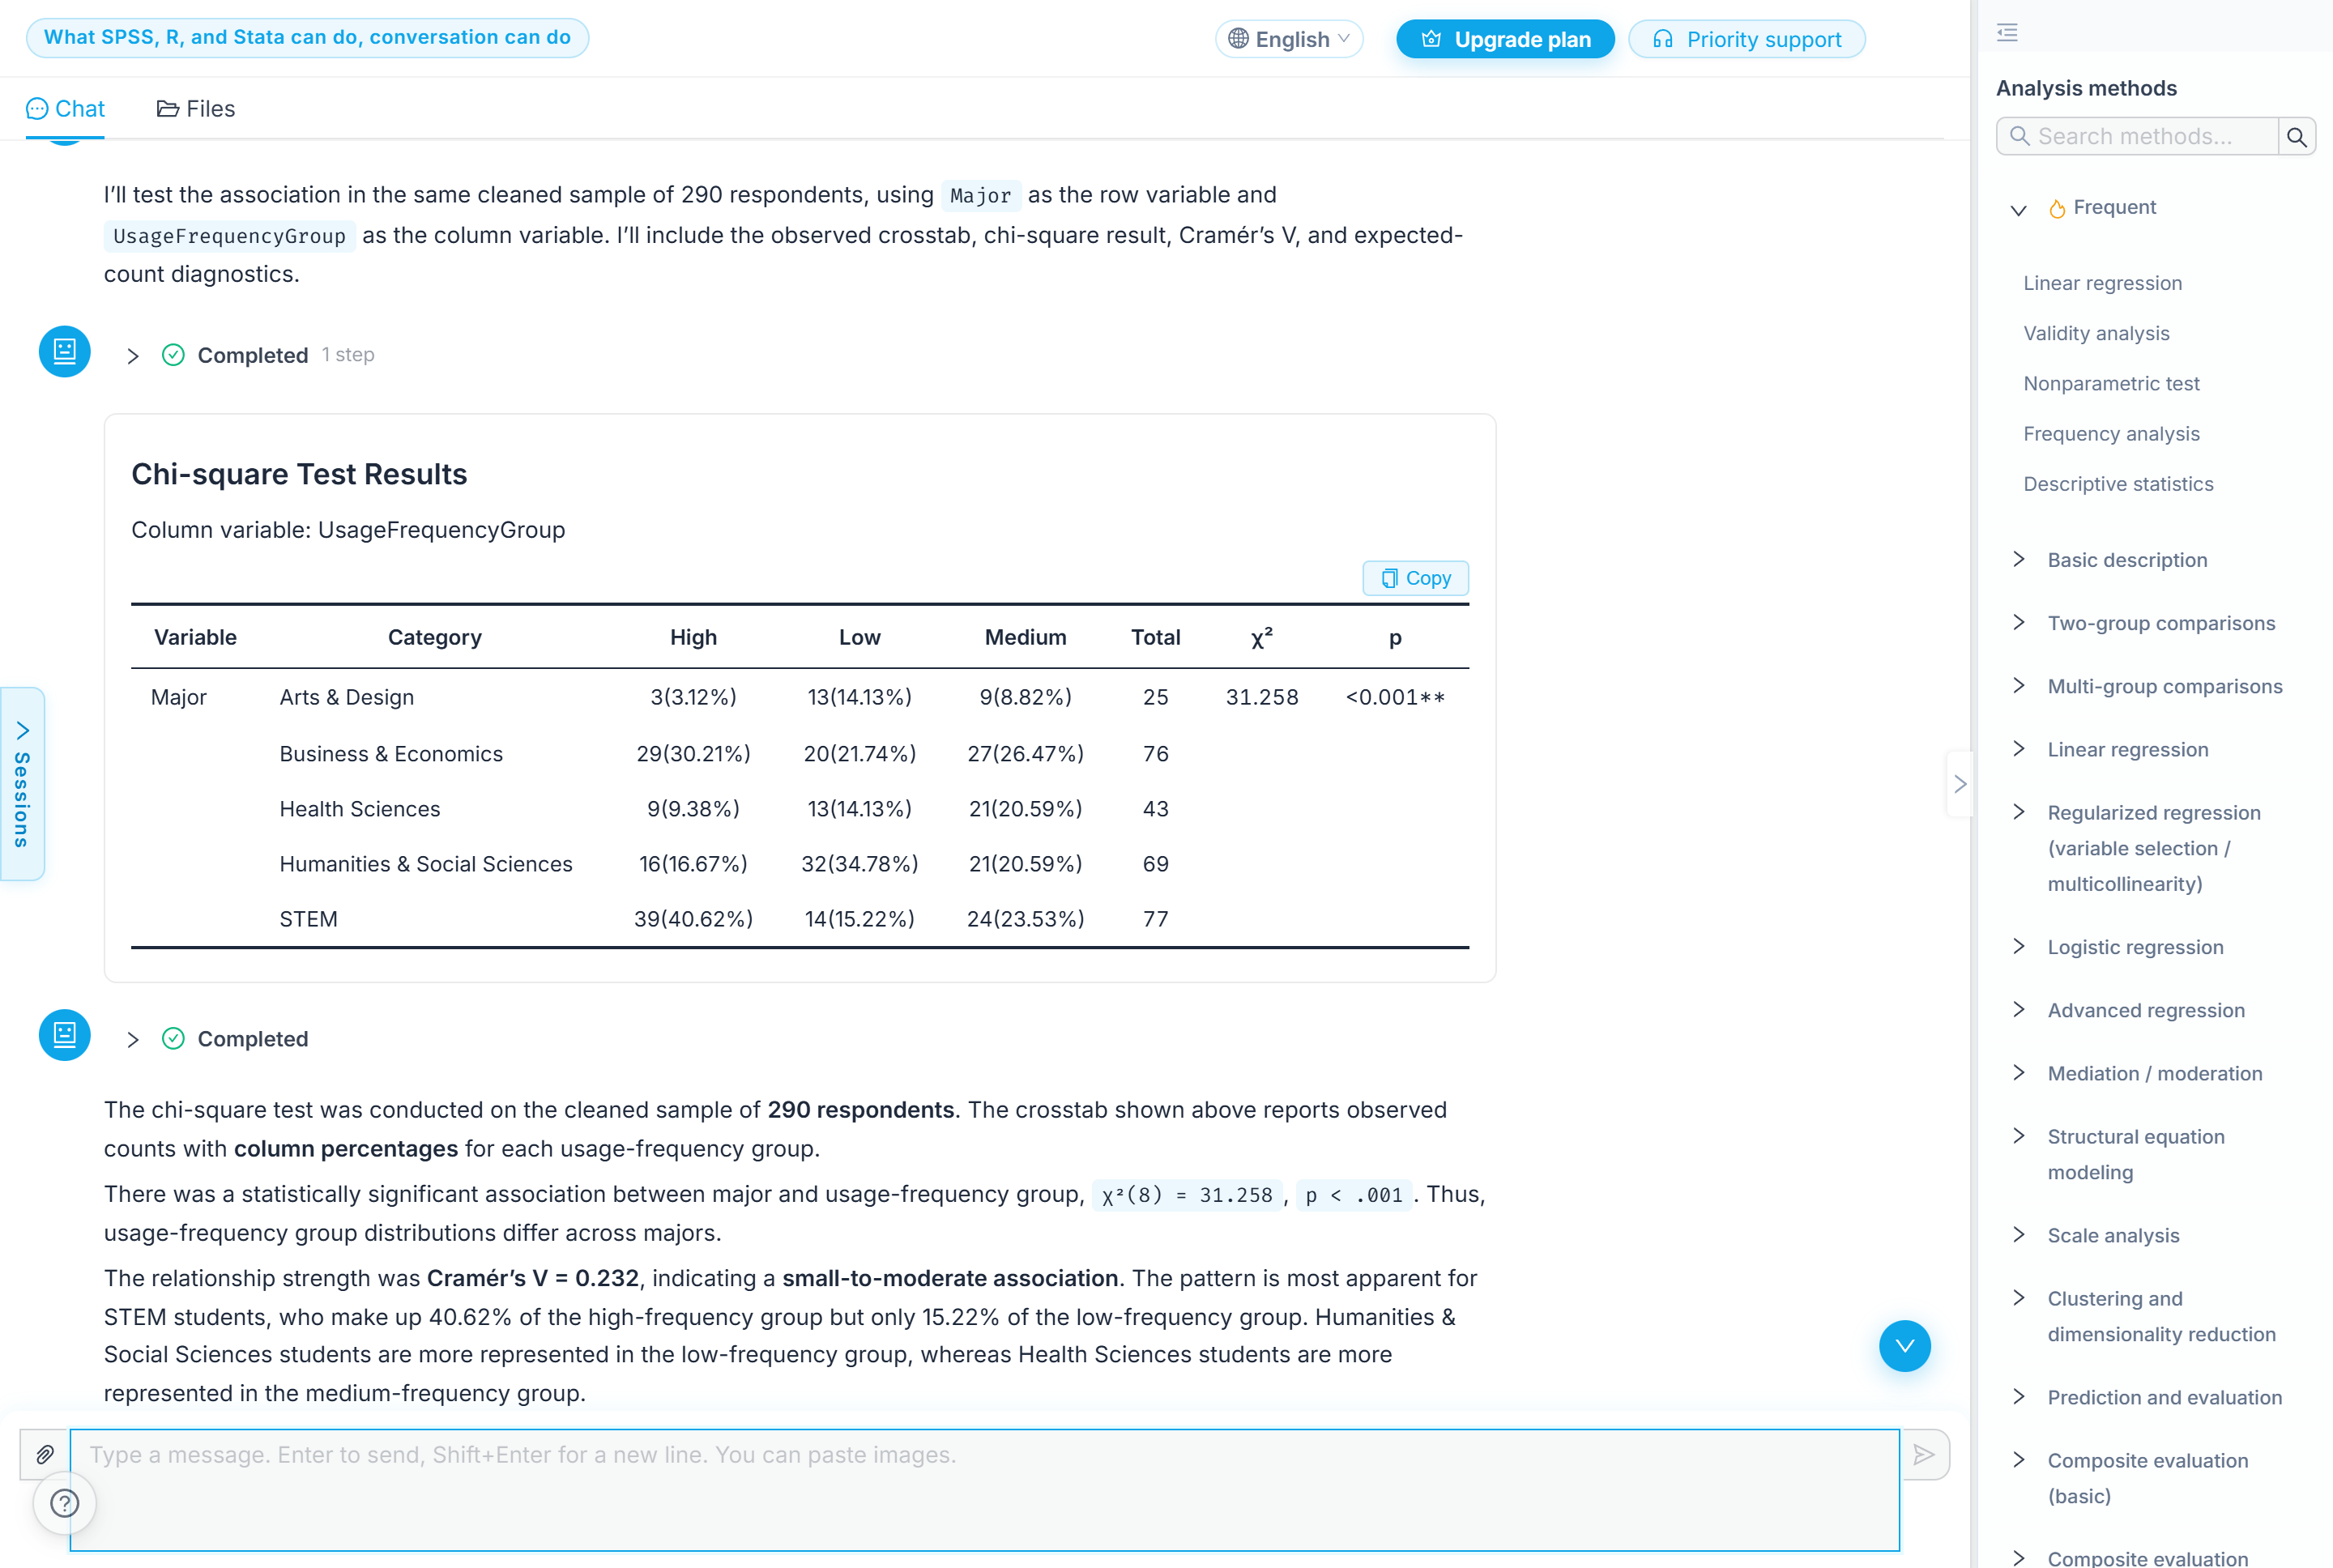 The ChatSRS interface this walkthrough was run in — the uploaded demo survey, the chat panel, and the analysis-methods list on the right.
One Plain-English Prompt: the Test, the Strength, and the Assumption Check
I uploaded the file and typed one line: "Run a chi-square test to see whether major and usage frequency group are related. Give me the crosstab as well, and tell me how strong the relationship is and whether the expected counts are large enough." Three things asked at once — the test, the strength of the relationship, and the assumption check — asked up front rather than after seeing the result.
It set out the plan before running anything: "I'll test the association in the same cleaned sample of 290 respondents, using Major as the row variable and UsageFrequencyGroup as the column variable. I'll include the observed crosstab, chi-square result, Cramér's V, and expected-count diagnostics." Row variable, column variable, and the two extras, all named before a single number appeared.
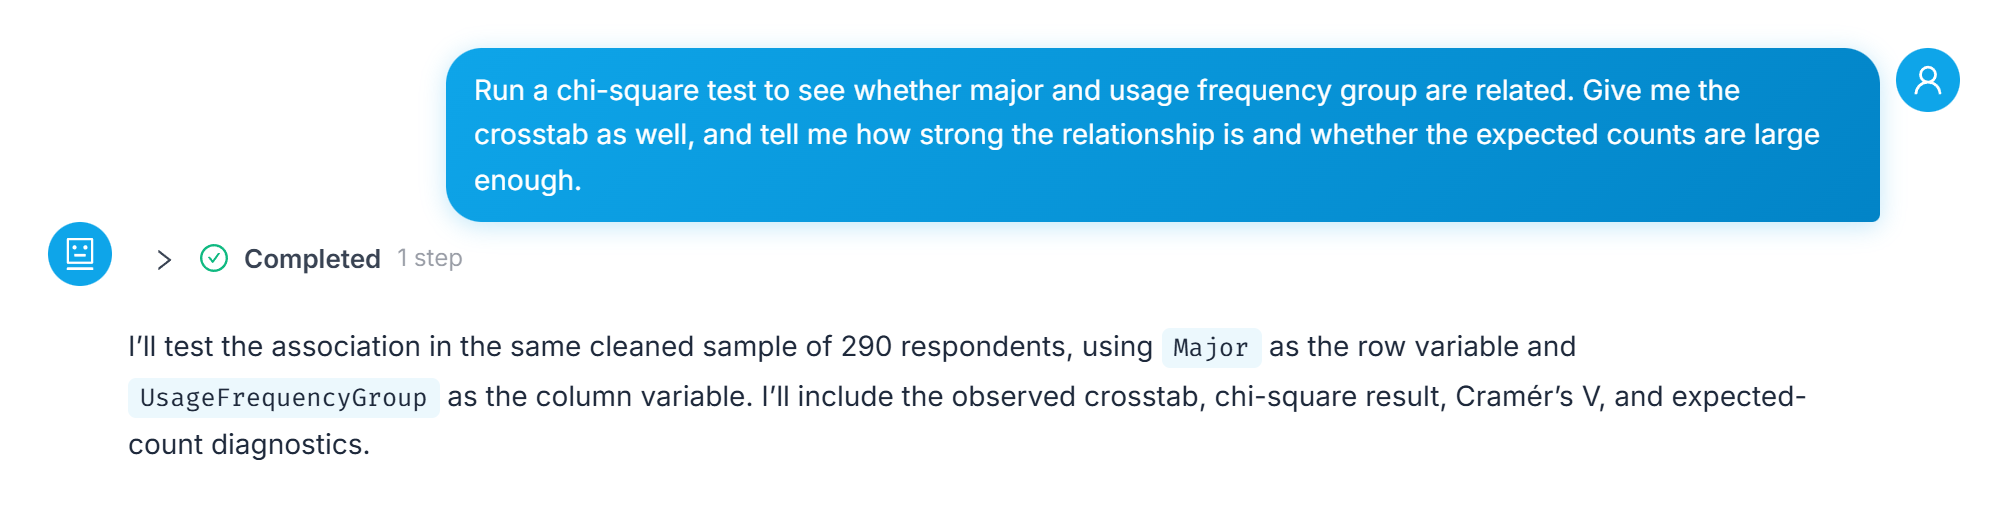 The prompt that started the run, and the plan it confirmed before producing any number.
The Crosstab That Came Back
Five majors by three usage groups, every cell carrying a count and its column percentage.
| Major | High | Low | Medium | Row total |
|---|---|---|---|---|
| Arts & Design | 3(3.12%) | 13(14.13%) | 9(8.82%) | 25 |
| Business & Economics | 29(30.21%) | 20(21.74%) | 27(26.47%) | 76 |
| Health Sciences | 9(9.38%) | 13(14.13%) | 21(20.59%) | 43 |
| Humanities & Social Sciences | 16(16.67%) | 32(34.78%) | 21(20.59%) | 69 |
| STEM | 39(40.62%) | 14(15.22%) | 24(23.53%) | 77 |
Source: ChatSRS "Chi-square Test Results" output on simulated survey data, N = 290 (demo data, not real thesis data). Column variable: UsageFrequencyGroup. The right edge of the same table carries the test statistic: χ² 31.258, p <0.001**.
STEM is 39(40.62%) of the high-frequency group and 14(15.22%) of the low. Arts & Design runs the other way — 3(3.12%) high against 13(14.13%) low. Humanities & Social Sciences is 32(34.78%) of the low group.
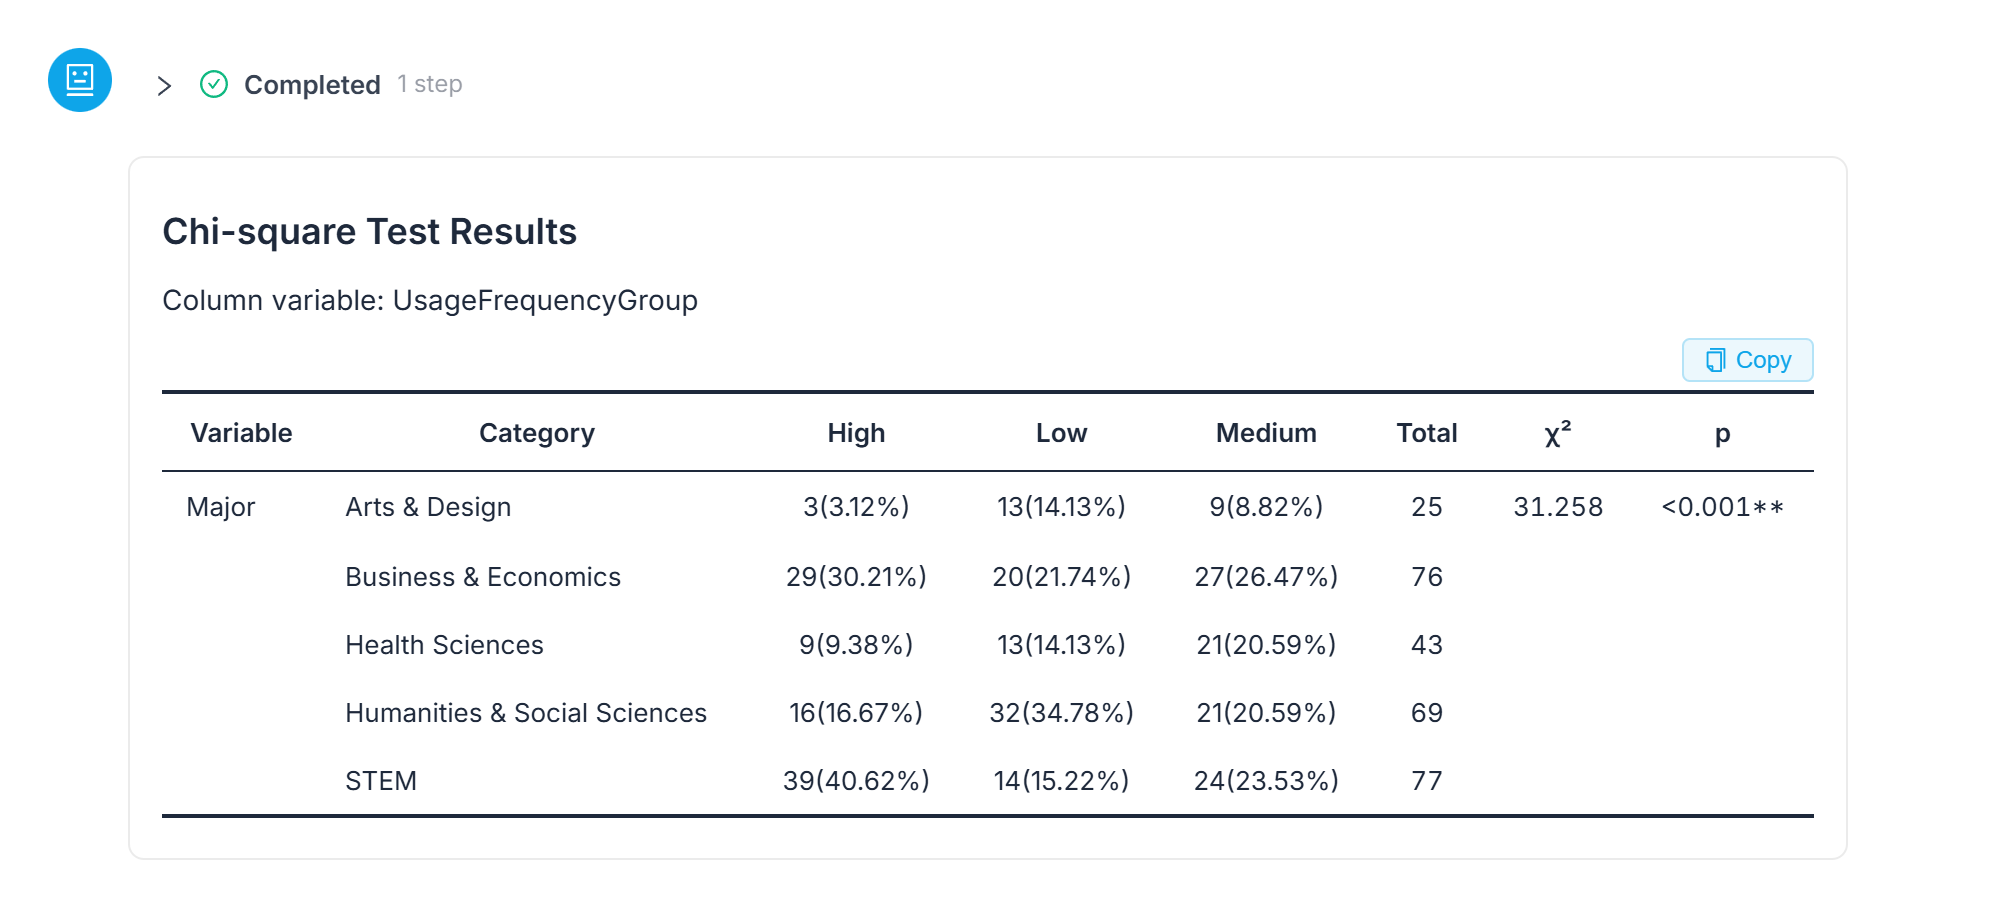 The crosstab exactly as returned — all fifteen cells plus the test statistic at the right edge, so any quoted cell can be checked against the rest.
Significance, Strength, and Licence to Report — in One Answer
This is the part a button labelled "chi-square" would not have handed me. The verdict first: "There was a statistically significant association between major and usage-frequency group, χ²(8) = 31.258, p < .001." Then the strength: "The relationship strength was Cramér's V = 0.232, indicating a small-to-moderate association." Then the assumption, as two flat lines: "Minimum expected count: 7.93" and "Cells with expected counts below 5: 0 of 15."
| What it answers | The number | What it does not answer |
|---|---|---|
| Do the distributions differ? | χ²(8) = 31.258, p < .001 | By how much |
| By how much? | Cramér's V = 0.232, small-to-moderate | Which way it runs |
| Was the test entitled to run? | Minimum expected count: 7.93; cells below 5: 0 of 15 | Anything about causation |
Source: ChatSRS chi-square output, N = 290 (demo data, not real thesis data). All three lines came back in the same answer.
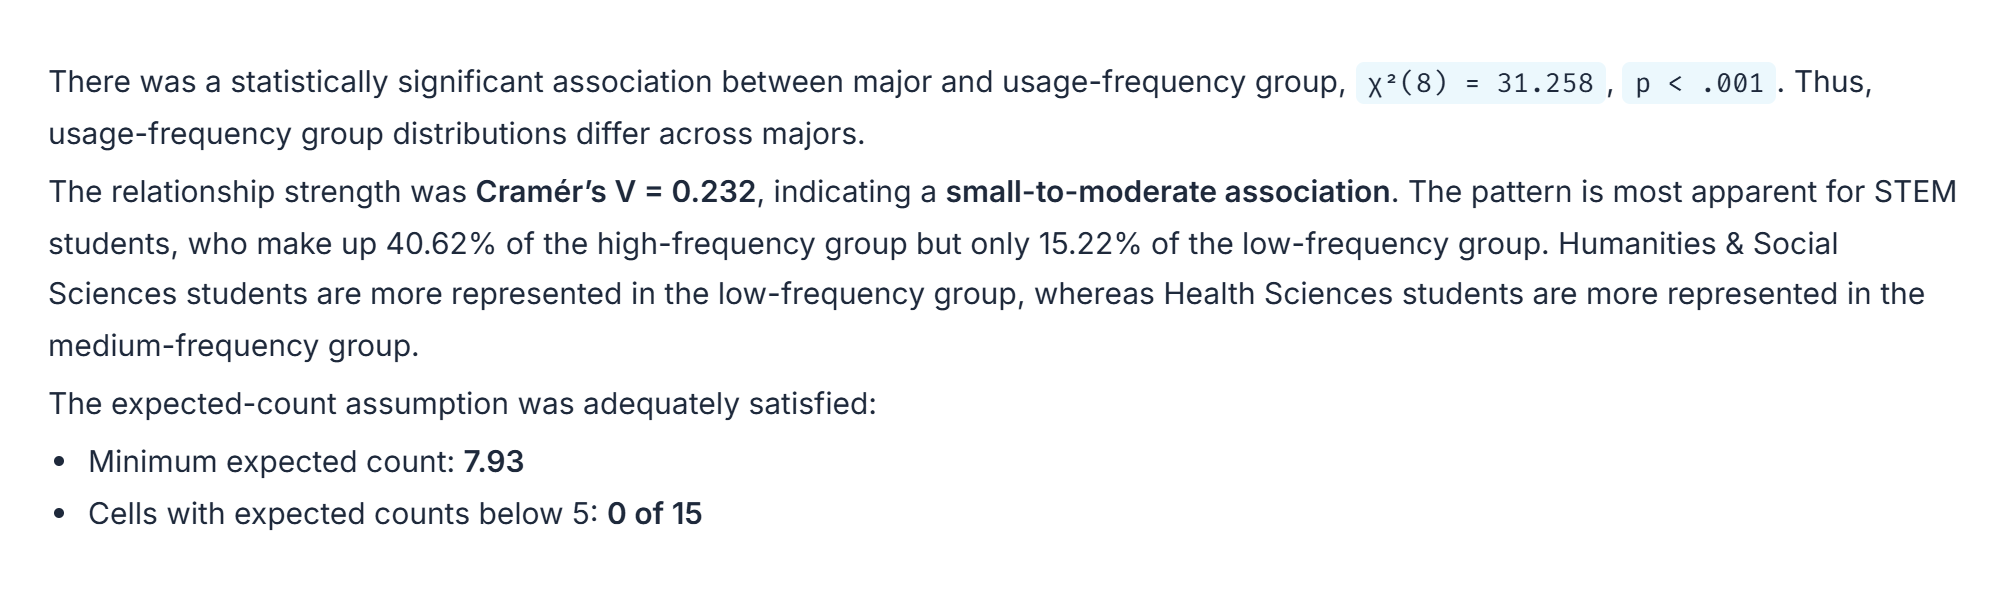 Significance, strength, and the assumption check in a single answer — the three things a results paragraph needs, none of them asked for twice.
What the Expected-Count Lines Are Actually For
A chi-square p-value tells you the distributions differ, not by how much. Cramér's V is the how-much, and here it came back small-to-moderate. The expected-count lines are what licenses reading either of them: the test is an approximation, it gets unreliable when cells are too thin, and no cell here was — the smallest expected count was 7.93, and 0 of 15 cells fell below 5.
One limit the product stated itself, worth carrying straight into a write-up: "The finding indicates an association, not a causal effect of major on AI-use frequency." Check the AI's reasoning yourself before any of this becomes a sentence in your thesis.
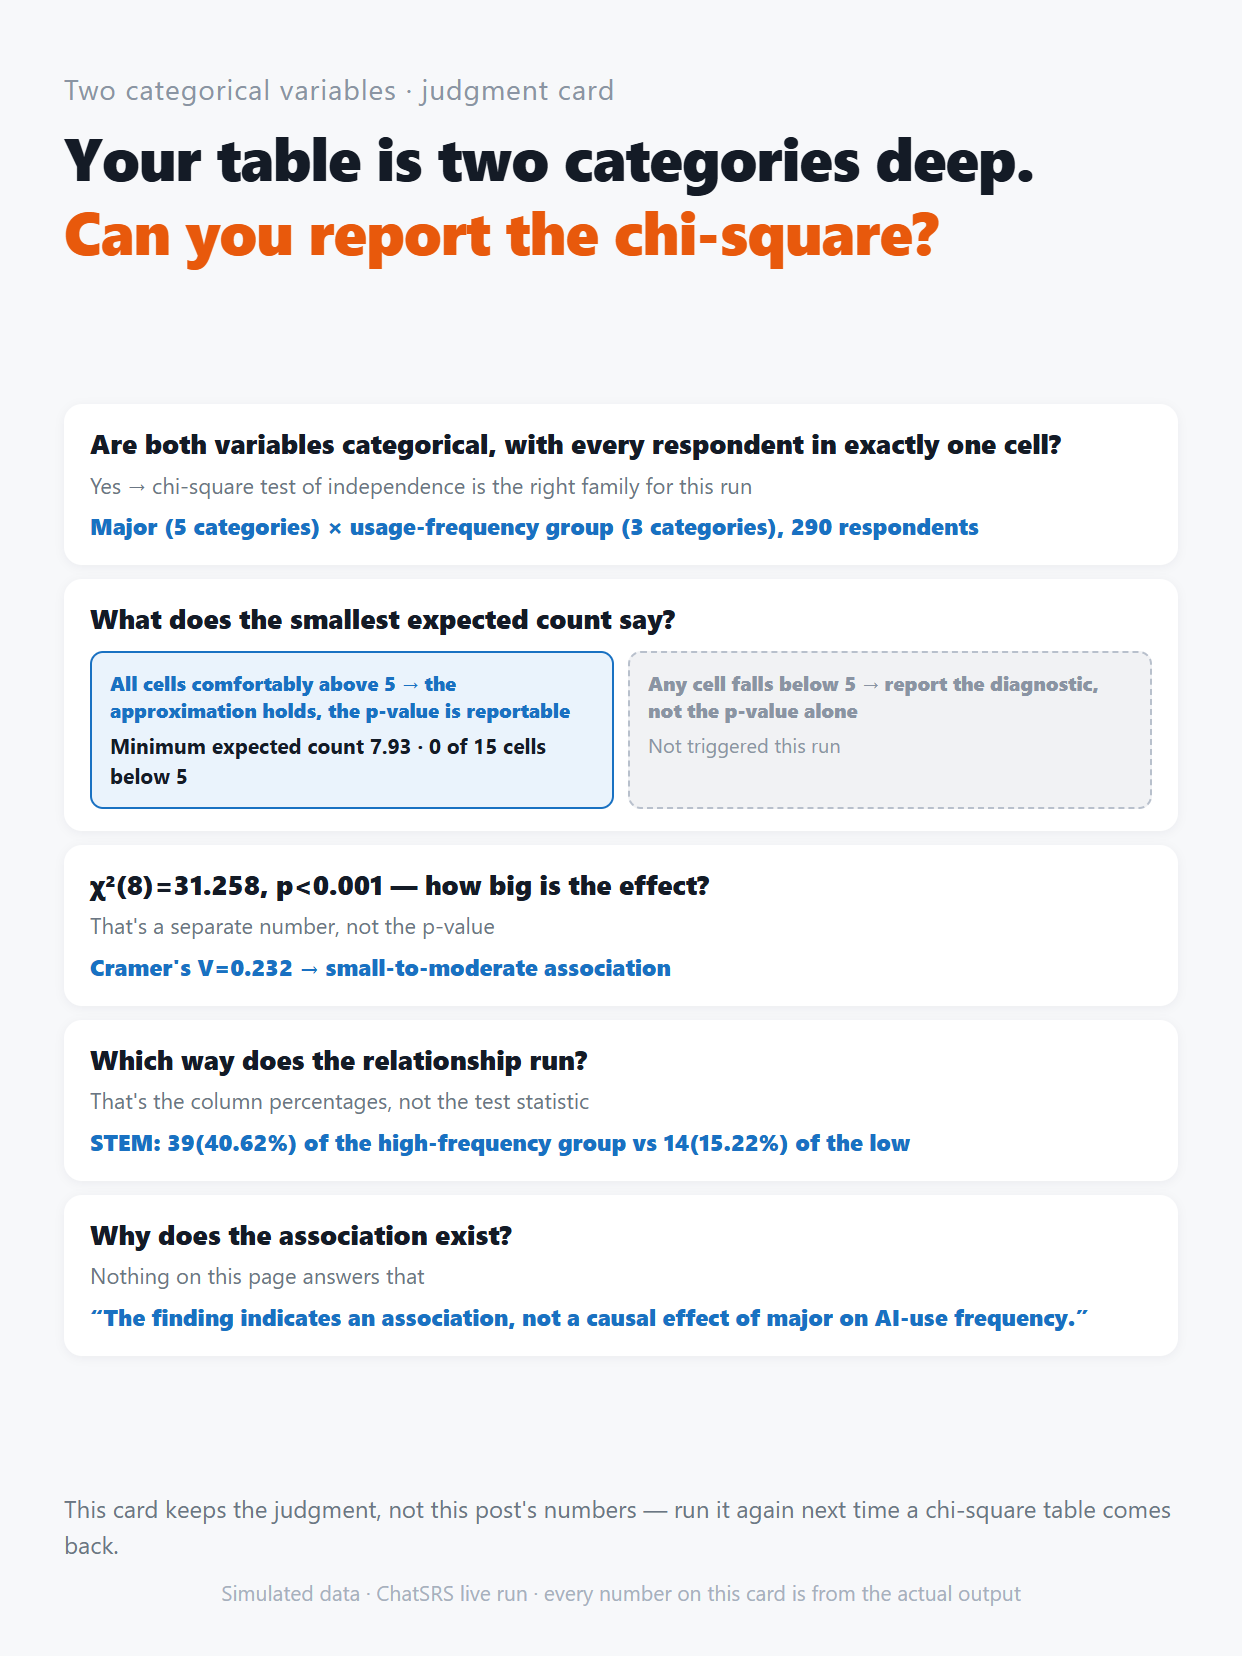 A judgment card for your own table: is it a chi-square question, does the smallest expected count clear 5, and what a significant p-value still leaves unsaid.
What This Walkthrough Doesn't Cover
- Turning the three outputs into the sentences a results section wants — the order to write them in is covered in reading a chi-square output line by line.
- Comparing a continuous outcome across groups rather than cross-tabulating two categorical ones; that is a different test family, walked through in running an independent-samples t-test online.
- Choosing between two measures of association when both variables are continuous rather than categorical; see Pearson or Spearman, and how to tell which one your data needs.
- With cross-sectional demo data like this, a significant result supports an association, not a claim about cause.
Frequently Asked Questions
Do I have to check expected counts myself, or can the AI do it in the same run?
You can ask for it in the same sentence. In this walkthrough the expected-count check was named in the original prompt alongside the test and the effect size, and all three came back in one answer: "Minimum expected count: 7.93" and "Cells with expected counts below 5: 0 of 15."
What does Cramér's V add that the p-value doesn't?
Size. A chi-square p-value says the distributions differ; it says nothing about how far apart they are. Cramér's V is the separate strength number — here 0.232, which the output called a small-to-moderate association.
My chi-square is significant. Can I say which group drives it?
Not from the test. Direction comes from the column percentages in the crosstab, not from χ² or p. In this run that is what shows STEM at 39(40.62%) of the high-frequency group against 14(15.22%) of the low.
Does a significant chi-square mean one variable causes the other?
No. The output said so itself: "The finding indicates an association, not a causal effect of major on AI-use frequency." A crosstab from observational data cannot establish direction of cause.
What if some of my cells do fall below an expected count of 5?
Then the thing in question is the approximation, not the association. Report the diagnostic rather than the p-value on its own — in this run no cell fell below 5, so the question never arose.
Bottom Line
A chi-square run isn't finished at χ² and p. Naming the crosstab, the effect size, and the expected-count check in one prompt is what turns a single number into a result you can defend — significance, strength, and the licence to report either, in the same answer.
Run your own chi-square test in ChatSRS — bring two categorical variables; the crosstab, Cramér's V, and the expected-count diagnostics come back in the same pass.