Statistical Tutorial ·
Exploratory Factor Analysis: How to Run It From a Plain-English Prompt
A full walkthrough of running an exploratory factor analysis online: one plain-English prompt in, KMO and Bartlett's test read back, variance explained, and a rotated loading matrix out, on a 20-item, five-construct demo survey (N = 300).
Running an exploratory factor analysis online means uploading your survey data, describing the constructs you designed in plain English, and letting the tool check sampling adequacy, extract factors, and flag any item that doesn't fit — all in one pass, demonstrated below on a 20-item, five-construct demo survey (N = 300).
Reliability gets checked first, and then someone asks about validity. Reliability is the easier idea: ask the same people again and the answers hold still. Validity is harder — whether the items are measuring the thing you think they're measuring. Items can be perfectly consistent and consistently measuring something else. That's a different construct from reliability; if you haven't run that check yet, see how to run, interpret, and report Cronbach's alpha first.
The usual route to a validity answer is exploratory factor analysis, and the reputation it has is earned: a KMO figure, Bartlett's test of sphericity, a variance table, and a twenty-row rotated loading matrix — most of which people meet for the first time on the day they need to report them. It's easy to stall before the first table, because it isn't obvious which table answers which question.
What This Walkthrough Covers
Demo data: a simulated survey, N = 300, twenty items designed around five constructs — not real thesis data. This walkthrough uploads it, asks the question in the words a person would actually use, and then reads back the three tables that come out: whether the data is even suitable for factor analysis, how much of the survey five factors explain, and which item sits on which factor. This page is the running-the-analysis half of the exploratory factor analysis workflow; for the fuller reliability-then-validity picture, see a broader questionnaire reliability and validity workflow.
Prompt In, Plan Out
The whole thing started as one line, in plain language rather than menu clicks: "I want to check whether my questionnaire items group the way I designed them — can you run an exploratory factor analysis? I built it around five areas; does the data actually split into those five? Check first whether this data is even suitable for it, then tell me if any item wandered into the wrong group or doesn't fit anywhere."
Before touching anything, it laid out a plan: "I will assess factorability first, then extract and rotate a five-factor exploratory solution for all 20 construct items." Then a caveat that wasn't asked for and wouldn't have been obvious to ask for: "A five-factor EFA tests the proposed grouping directly; it does not confirm the model in the same way as a CFA, but it identifies whether items cluster as expected and flags cross-loading or weak items." That's the limitation of the method, stated before the analysis ran, by the thing running it.
It also caught a problem in the file before running anything. The column headers were full sentences, and several contained commas — the same character the analysis interface uses to separate variables. Its fix, stated plainly: "I will preserve the raw data and use an analysis-only copy with the same 20 item values renamed PU1 through BI4, then rerun the single five-factor extraction." The uploaded file itself was left exactly as it was; it built a working copy and said so.
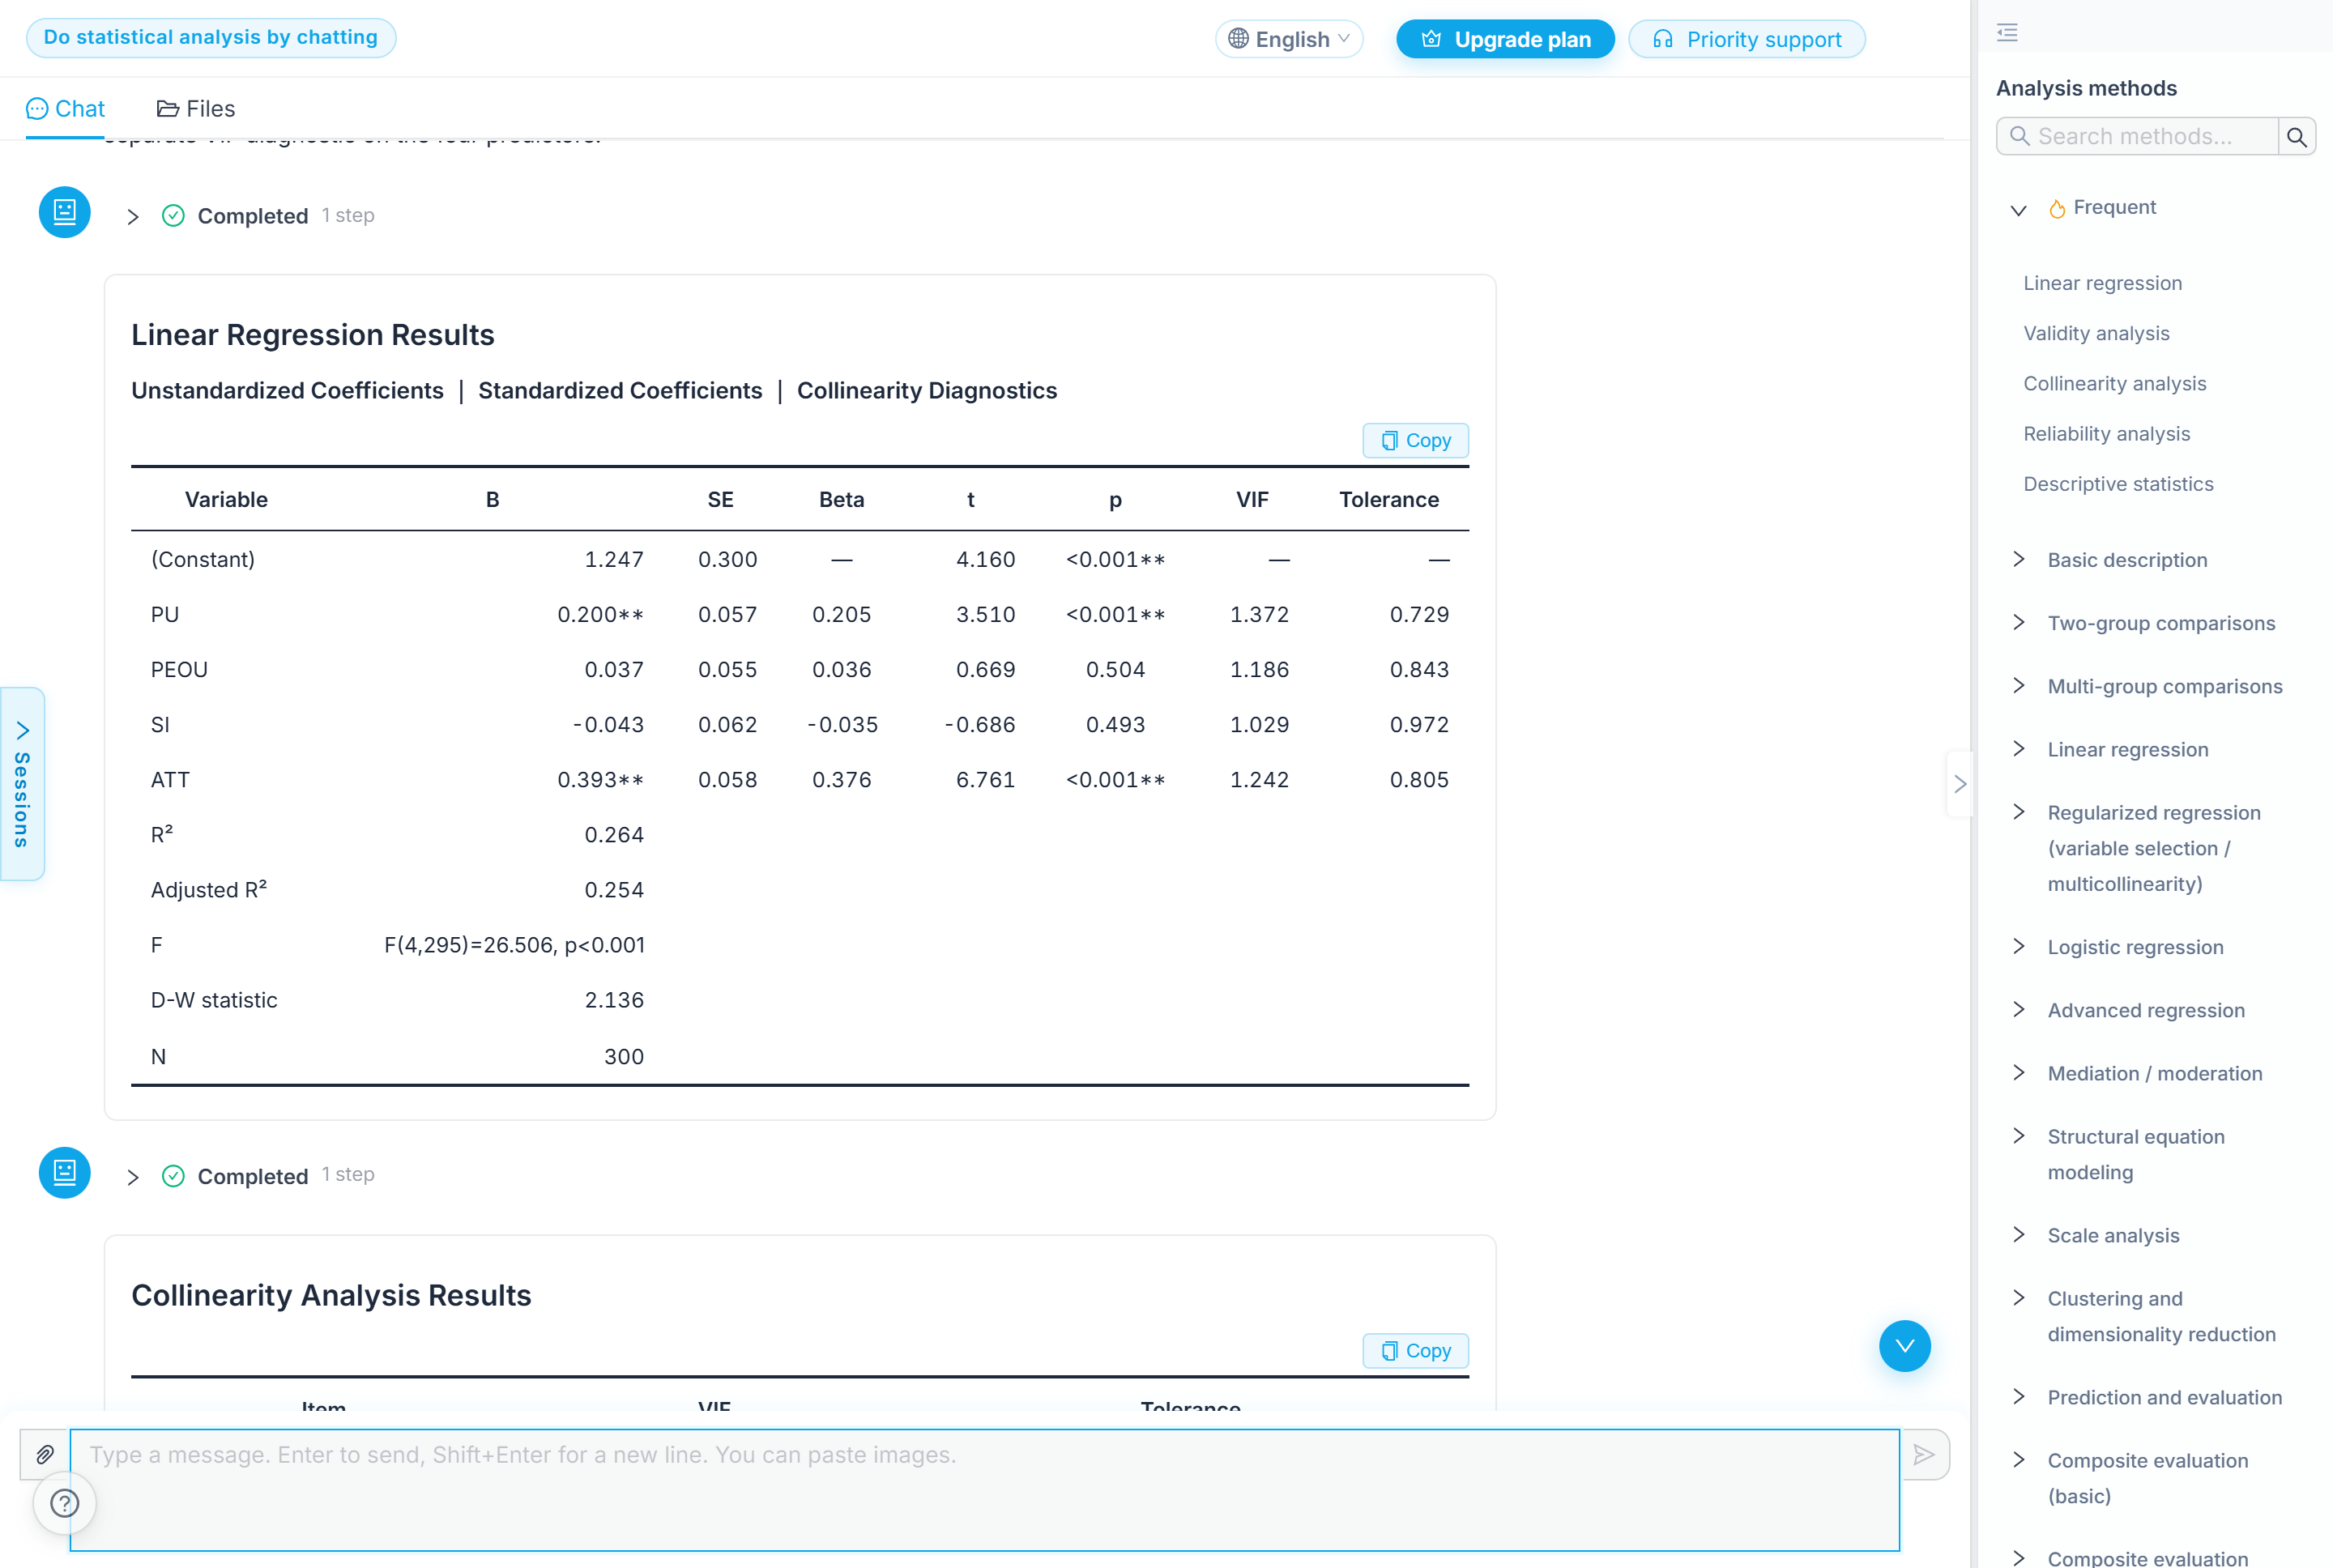 ChatSRS's English interface, with Validity analysis listed in the Frequent group of the analysis methods panel.
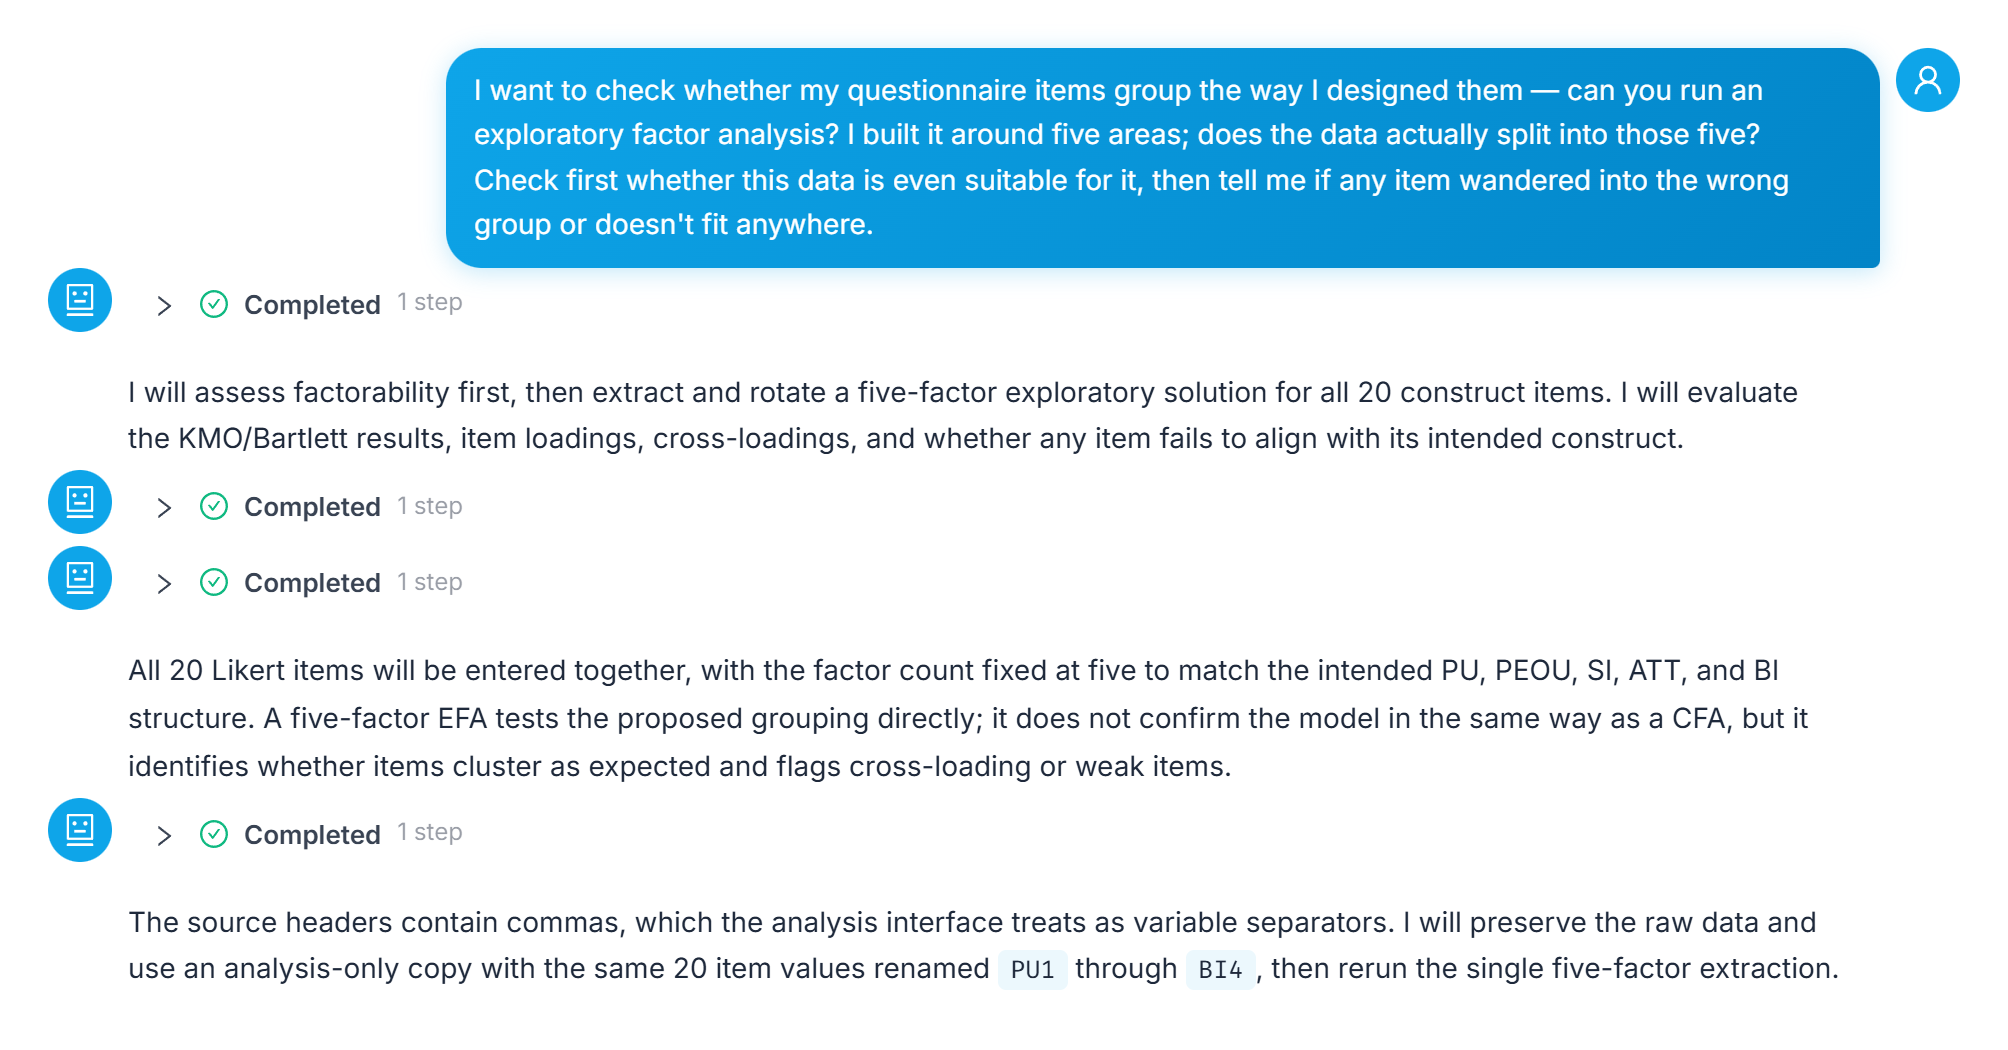 The prompt as typed, followed by the tool's extraction plan, its caveat about what a five-factor EFA does and doesn't confirm, and its fix for the comma-in-headers problem.
How to Read the Output: Three Tables, Three Questions
What came back was three tables, each answering exactly one question.
| What it checks | Test / statistic | Result |
|---|---|---|
| Is the data suitable for factor analysis at all? | KMO measure of sampling adequacy | 0.872 |
| Is the data suitable for factor analysis at all? | Bartlett's test of sphericity | χ²(190) = 2924.273, p < .001 |
| How much of the survey do five factors explain? | Total variance explained | 69.62% |
Source: ChatSRS exploratory factor analysis output on simulated survey data, N = 300, 20 items, five-factor extraction.
The first two numbers are the gate: fail them and nothing that follows means anything. The tool's own reading of them: "The KMO value was 0.872, indicating good sampling adequacy, and Bartlett's test of sphericity was significant, χ²(190) = 2924.273, p < .001. Thus, the item correlations contain sufficient common structure to justify factor extraction."
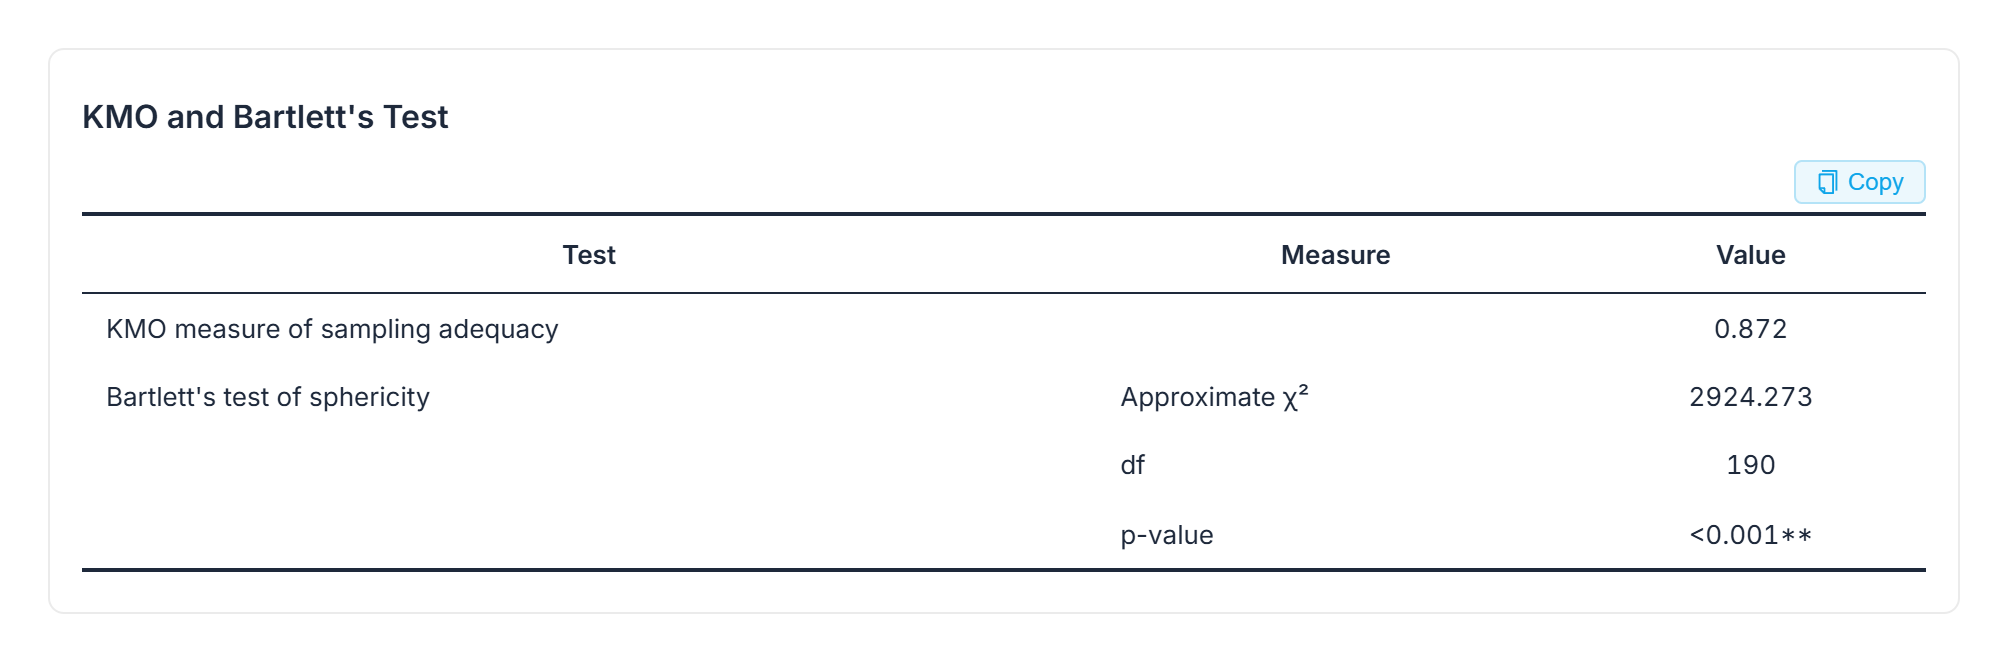 The complete KMO and Bartlett's Test table — KMO 0.872, approximate χ² 2924.273, df 190, p < .001.
 The paragraph where the tool reads its own KMO and Bartlett's result back in plain language.
The third table — a twenty-row rotated loading matrix with a communality column at the far right — is where each item's factor membership shows up. Reading that matrix row by row, and what a low communality can mean even when a loading looks fine, is its own topic: see the item that didn't fit for the full breakdown, on these same tables.
How Good Does the KMO Number Need to Be?
0.872 cleared the gate in this run, but "how high is high enough" is a convention question, and conventions vary by field and journal — the same goes for how much cumulative variance counts as enough, and whether the loading cutoff for calling an item a fit is .40 or .50. EFA results also have to be read against where the scale came from. Check the AI's judgment against your own field's convention rather than treating any single number as a universal cutoff.
What This Run Does Not Answer
One limitation worth stating plainly, since it changes what this run can and cannot tell you: the factor count was fixed at five because the prompt supplied it — the questionnaire was built around five areas, so that's what got tested. That directly tests the grouping as designed. It does not answer the different question of how many factors the data would produce if nothing were specified about the count; that would need a separate, unconstrained run.
The results also split down the middle on the two questions actually asked. Did anything wander into the wrong group? No — the tool's own words: "No items showed problematic cross-loadings: each well-performing item had a clear primary loading, while its loadings on the other four factors remained low." Nineteen items landed where the design said they would. Did anything fit nowhere? Yes — one. Which item, how to spot that kind of failure specifically, and what to do about it is the full subject of the item that doesn't fit.
When This Doesn't Apply
- A five-factor EFA that tests a pre-specified grouping is not the same run as letting eigenvalues decide the factor count on their own. If the question is "how many factors does this data actually have," that needs a separate, unconstrained extraction.
- An EFA isn't a confirmatory factor analysis: it tests whether items cluster as expected and flags problems, but it doesn't confirm a model the way a CFA does.
- If the open question is whether the items behave consistently — not whether they measure the right construct — that's reliability, and it's covered separately in how to run, interpret, and report Cronbach's alpha.
Frequently Asked Questions
Do I need to already know how many factors to expect before running this?
Not to run an EFA in general, but this particular run did: the factor count was fixed at five because the prompt specified the survey was built around five areas. That tests the intended grouping directly, but it doesn't answer how many factors the data would produce with nothing specified about the count — that needs a separate run.
What do KMO and Bartlett's test actually check?
Whether the data is even suitable for factor analysis in the first place. In this run, KMO was 0.872 and Bartlett's test was significant (χ²(190) = 2924.273, p < .001) — both indicate the item correlations contain enough common structure to justify extracting factors. Fail either one and the tables that follow aren't meaningful.
Does "no cross-loadings" mean every item passed?
No. Nineteen of twenty items in this run had a clear primary loading with low loadings on the other factors — no cross-loading. One item still failed a different check, on communality rather than cross-loading; see the full breakdown of that item.
Do I need SPSS or another stats package to run this?
No. The full run above — the factorability check, the five-factor extraction, the rotation, and reading each table back — happened inside ChatSRS's chat interface from one plain-English prompt, whether your usual workflow otherwise runs through SPSS, Stata, or R.
Bottom Line
Running an exploratory factor analysis online comes down to one plain-English prompt, a factorability check that gates everything after it, and three tables read in a fixed order — KMO and Bartlett's, variance explained, then the loading matrix. Nineteen items here landed exactly where they were designed to; the twentieth is a separate story.
Run your own exploratory factor analysis in ChatSRS — upload your survey data and describe the constructs in plain English.