Academic Reporting ·
Factor Loading Interpretation: What the Rotated Matrix Does (and Doesn't) Tell You
How to read a factor loading interpretation correctly: the KMO and variance tables, the rotated loading matrix, and why one item can clear .40 on every factor and still fail on communality.
Factor loading interpretation isn't just checking whether a number clears .40 — it also means checking communality, since an item can sit under the cutoff on every factor without technically cross-loading, and that's exactly what happened to one item in this 20-item, five-factor exploratory factor analysis (N = 300).
Validity output arrives as a stack: a KMO figure, Bartlett's test, a variance table, and a twenty-row matrix of decimals. Which of those numbers is the evidence that the scale passed? Which ones belong in the thesis? This walks through all of it on demo data — a simulated survey, N = 300, twenty items, not real thesis data.
What This Guide Covers
This is the results-reading companion to running an exploratory factor analysis — same simulated survey data, same 20-item, five-construct design, whether the analysis ran in SPSS, Stata, R, or a conversational tool. This page is about what to do with the tables once they're in front of you, and about the one item that looked fine on the number everyone checks and wasn't.
Table One: Is the Data Suitable for This at All?
KMO = 0.872 and Bartlett's approximate χ² = 2924.273, df = 190, p < .001. The tool's own reading: "The KMO value was 0.872, indicating good sampling adequacy, and Bartlett's test of sphericity was significant, χ²(190) = 2924.273, p < .001. Thus, the item correlations contain sufficient common structure to justify factor extraction." These two numbers are reported in essentially every EFA write-up, and they gate everything below — fail either one and the rest isn't meaningful.
Table Two: How Much of the Survey Do the Factors Account For?
The five-factor solution accounts for 69.62% of total item variance.
| Factor | Eigenvalue | Cumulative variance explained |
|---|---|---|
| 1 | 5.993 | 29.96% |
| 2 | 2.768 | 43.80% |
| 3 | 2.069 | 54.15% |
| 4 | 1.612 | 62.21% |
| 5 | 1.483 | 69.62% |
Source: ChatSRS Total Variance Explained output, simulated survey data, N = 300, five-factor extraction.
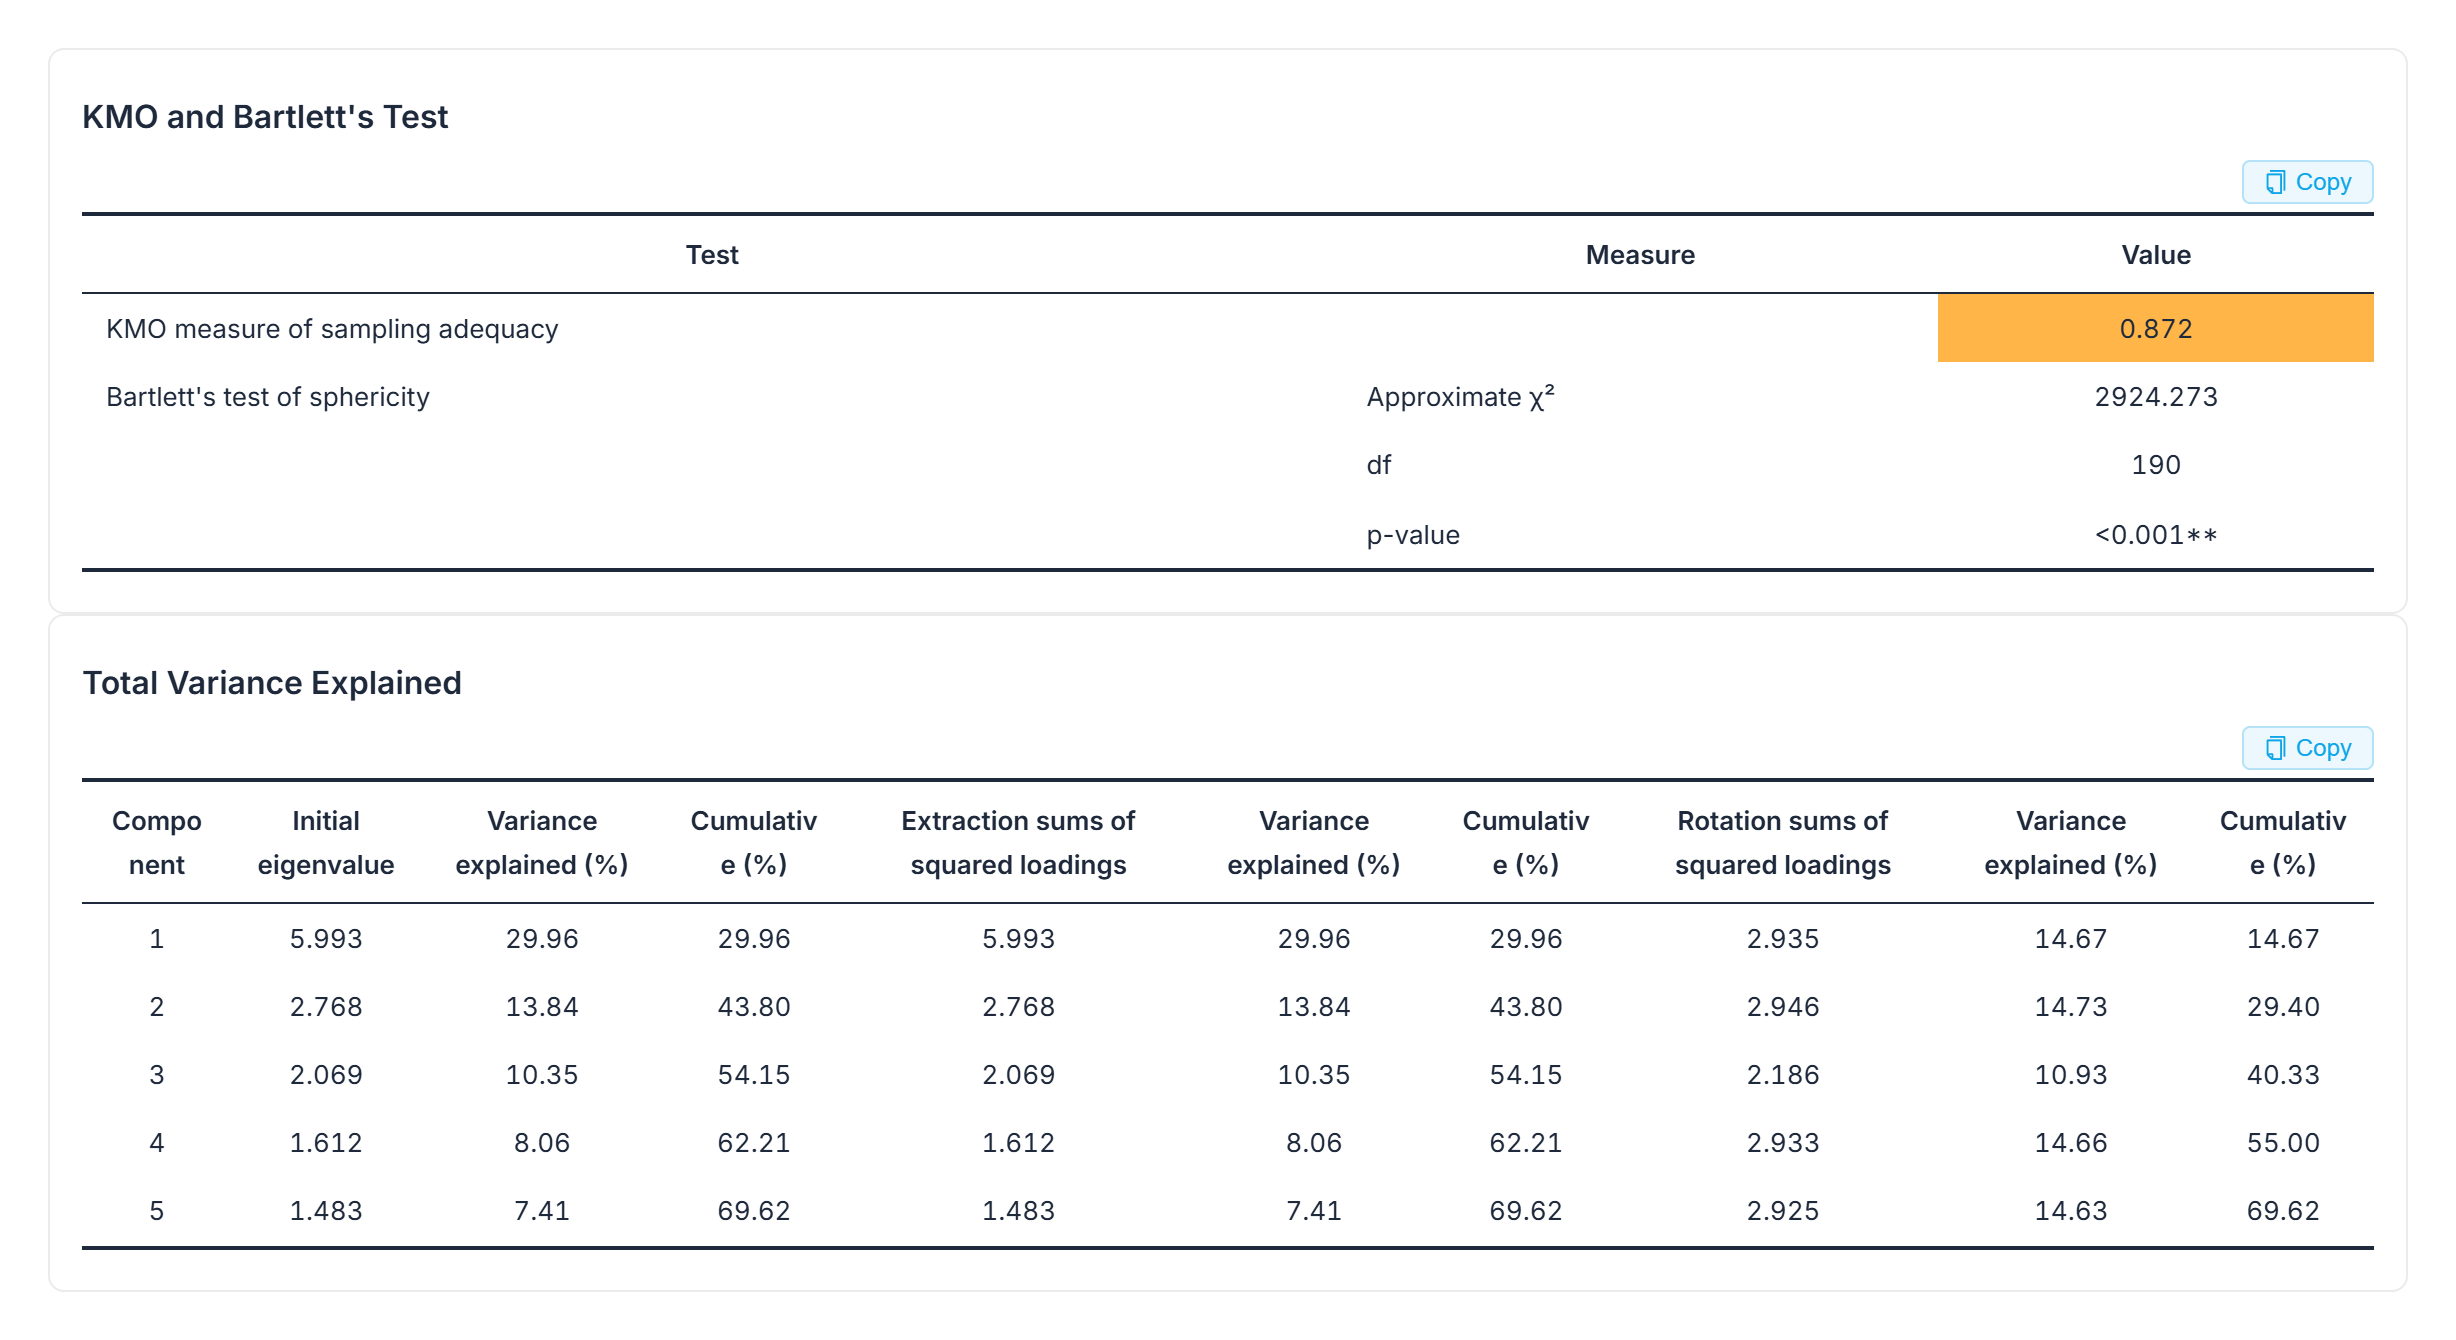 Two tables in one frame: KMO and Bartlett's Test (KMO 0.872, χ² 2924.273, df 190, p < .001), then Total Variance Explained, five components, eigenvalues and cumulative variance ending at 69.62%.
Table Three: Does Each Item Sit Where the Design Put It?
Mostly, yes, and cleanly.
| Construct | Item(s) | Factor | Loading range |
|---|---|---|---|
| Perceived usefulness (PU) | 4 items | Factor 1 | .807–.815 |
| Perceived ease of use (PEOU) | 4 items | Factor 2 | .830–.837 |
| Social influence (SI1–SI3) | 3 of 4 items | Factor 3 | .805–.829 |
| Behavioral intention (BI) | 4 items | Factor 4 | .795–.851 |
| Attitude (ATT) | 4 items | Factor 5 | .800–.813 |
| Social influence (SI4) | 1 of 4 items | Factor 3 (below cutoff) | .347 |
Source: ChatSRS rotated factor loading matrix, simulated survey data, N = 300. Nineteen of the twenty items sit at communalities between .650 and .755; SI4's communality is .147 — see below.
The tool's summary of the clean part: "No items showed problematic cross-loadings: each well-performing item had a clear primary loading, while its loadings on the other four factors remained low." One thing worth not reading too much into: the factor numbers don't run in the order the questionnaire does — Attitude comes out as factor 5, Behavioral intention as factor 4. The tool addressed that directly: "The factor labels appear in a different numerical order from the questionnaire design, but this has no substantive implication; factor numbers are arbitrary."
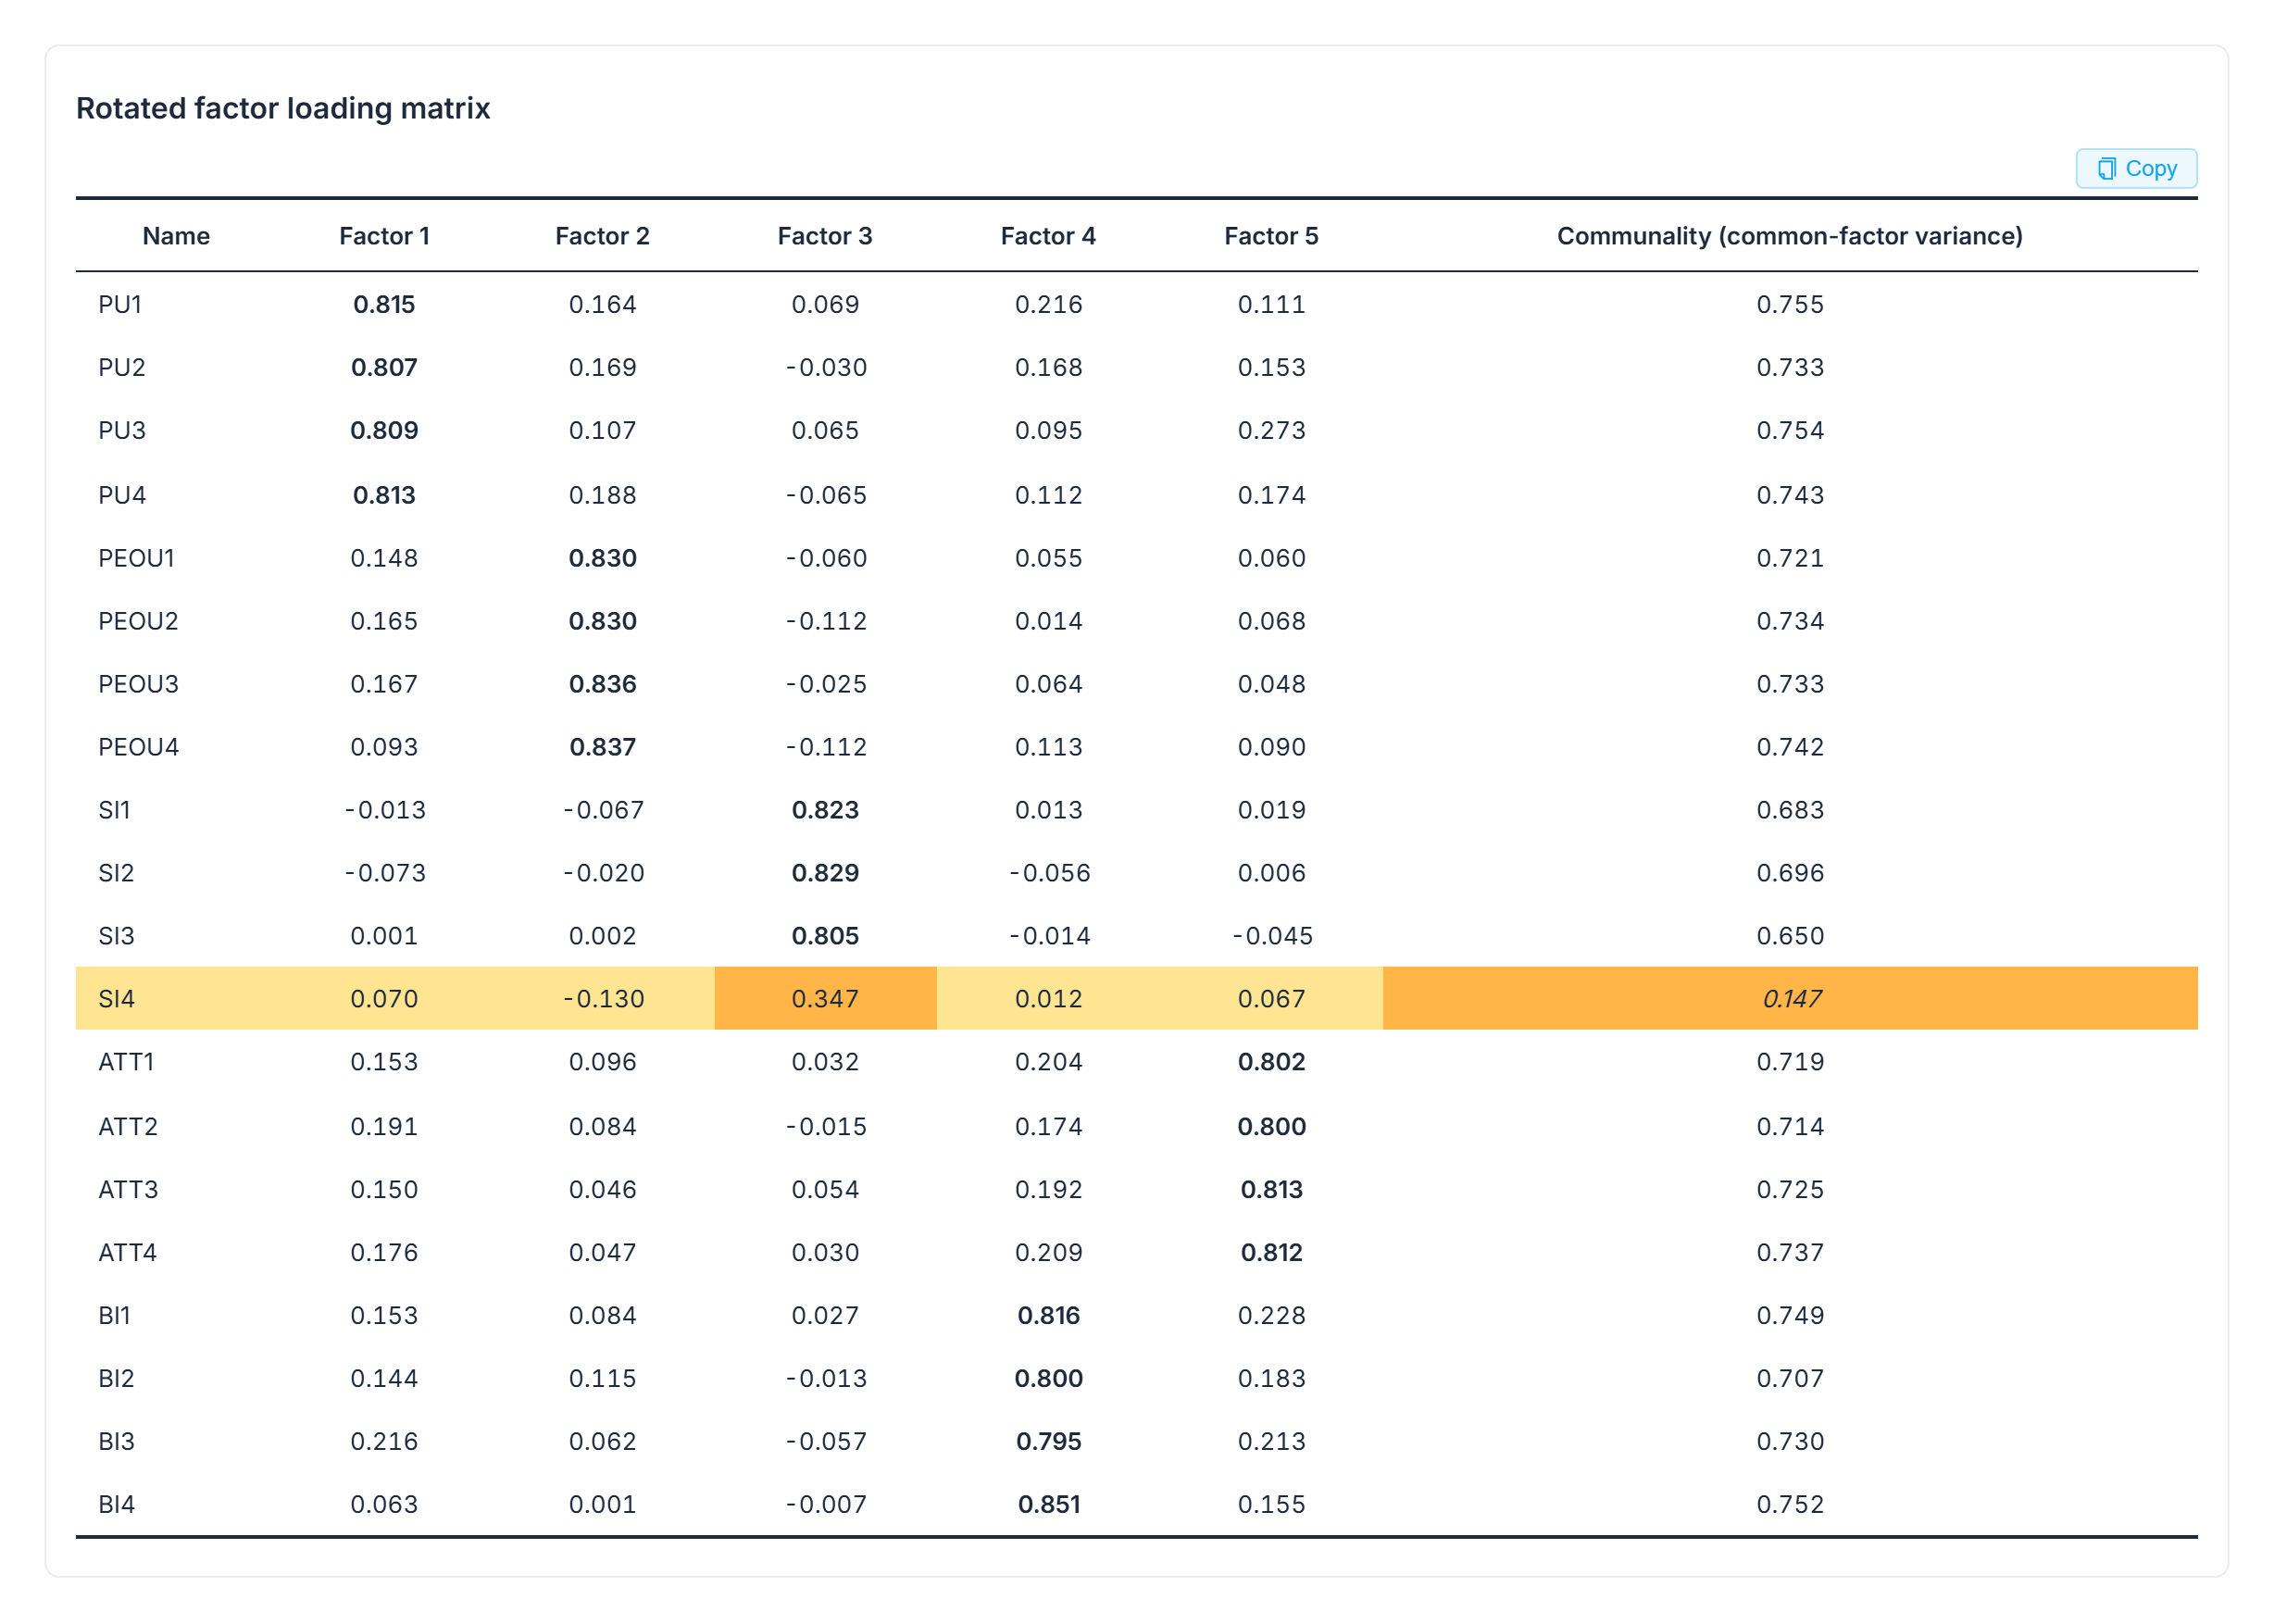 The full twenty-row rotated loading matrix, factors 1 through 5 plus the communality column, with the SI4 row and its .347 and .147 values called out.
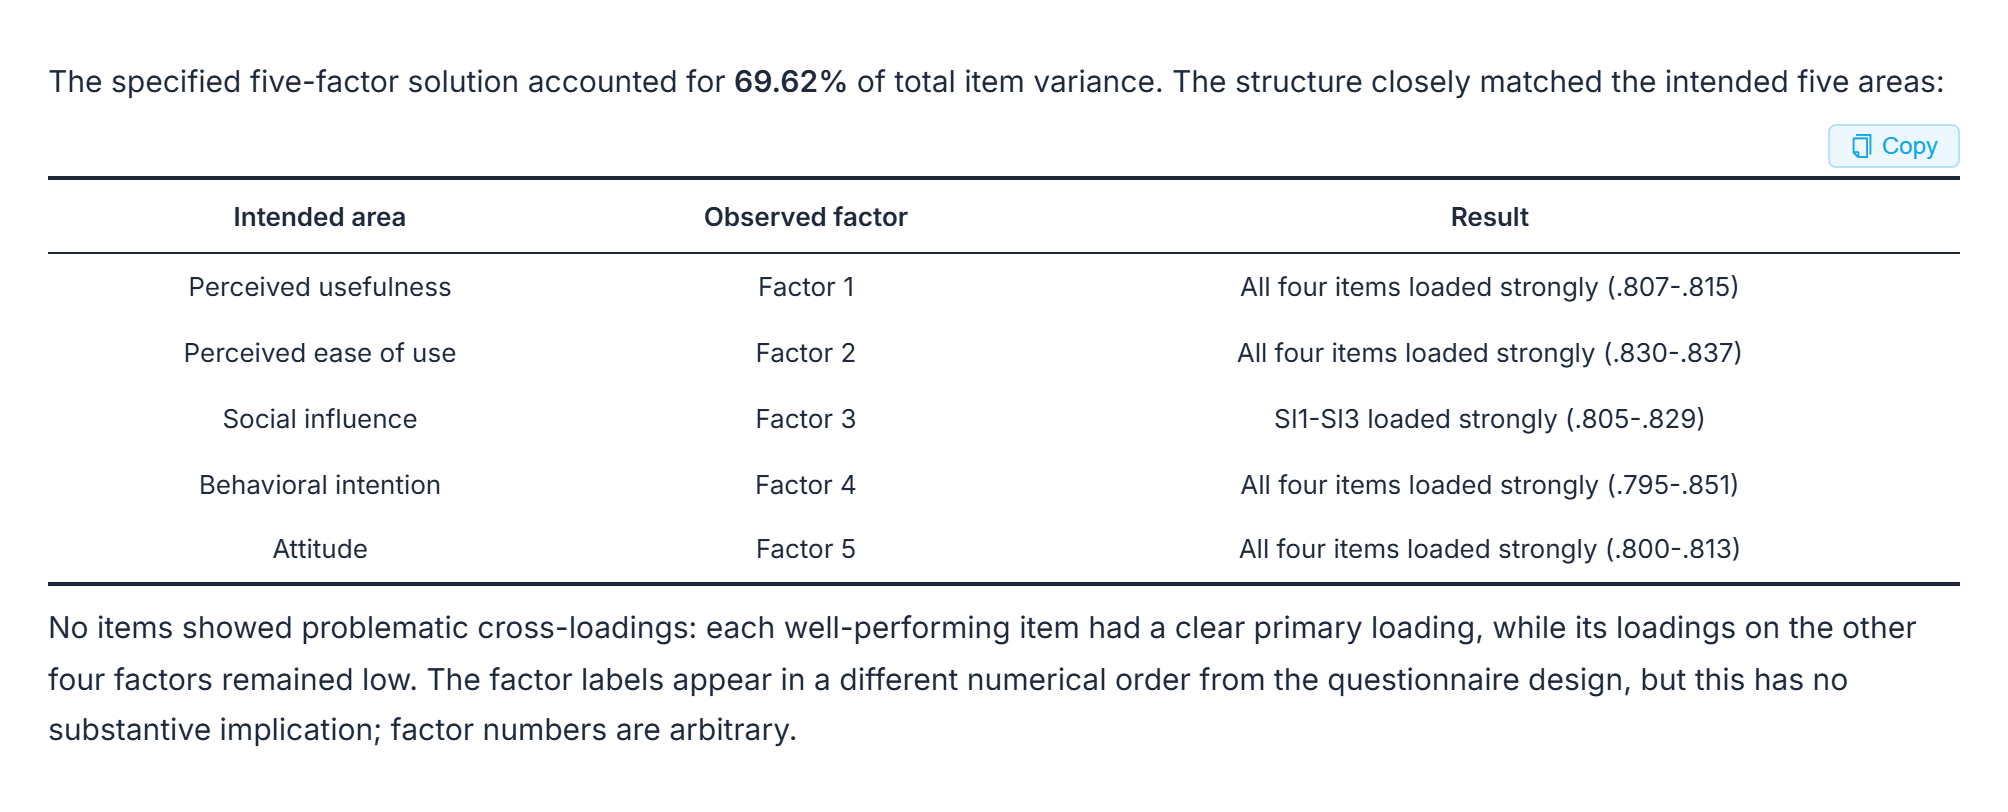 The intended construct area matched against the observed factor for each group of items, alongside the note that factor numbers are arbitrary.
Loading vs. Communality: Two Different Checks
Then the twentieth item. SI4 — "My department has an official policy requiring us to use AI tools" — has a loading of .347 on the social-influence factor and a communality of .147. The tool's own words: it "did not load adequately on the social-influence factor (loading = .347, below the usual .40 threshold) and had very low communality (.147). In practical terms, this item shares little variance with the remaining scale and does not behave like the other three social-influence statements."
This is the part most write-ups get backwards, so it's worth slowing down on. The failure people are taught to look for is cross-loading — one item sitting on two factors at once, belonging to neither. SI4 doesn't cross-load. It doesn't load anywhere. Its highest value on any of the five factors is that .347, under the .40 line. Look only for cross-loadings, and this item passes inspection.
Communality is the column that catches it, and it's the column people skim. Communality is the share of an item's variance that the extracted factors account for — how much of what that item measures is part of the same thing the rest of the survey measures. Nineteen items here sit between .650 and .755. SI4 sits at .147. Almost everything it's measuring is something else.
And once you read the item, it stops being a mystery. The other three social-influence items ask about classmates using AI, professors encouraging it, and seeing people around you try it — all about the people around you. SI4 asks whether the department has a rule. The tool makes the same point: its wording "measures an institutional requirement rather than peer behavior or perceived social encouragement, which likely explains the mismatch." A mandate and a social norm are different things, so respondents answer them differently, and the statistics can see that even though the item was filed under the right heading.
What to Do With an Item Like This
Not this: leaving the item's responses corrected, or dropping the respondents whose answers make it look worst, so the loading crosses .40. Searches for whether validity numbers can just be written are common enough — the answer is no, and the exposure isn't worth what it saves.
The tool's actual recommendation: "For a revised scale score, exclude SI4 from the social-influence composite and retain SI1-SI3." And a next step past that: "Since the five-factor arrangement was specified in advance, the natural next validation step is a confirmatory factor analysis comparing the intended five-factor model with and without SI4." So: drop it from the composite, and if the scale matters to the argument, test both versions properly with a follow-up analysis rather than deciding by eye.
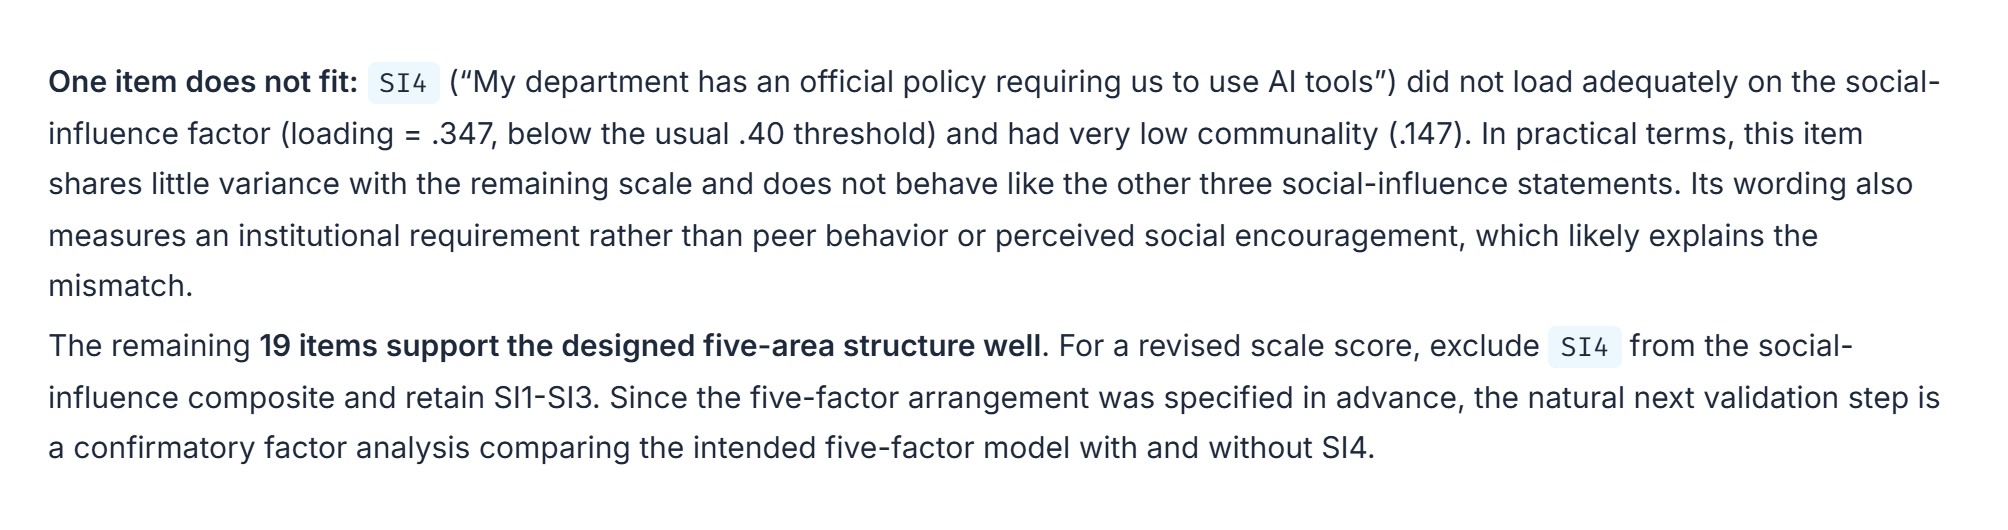 The paragraph diagnosing SI4's mismatch, followed by the recommendation to exclude it from the composite and the suggested confirmatory follow-up.
When This Doesn't Apply
- The .40 loading cutoff is a convention, not a law, and fields differ; whether an item can be dropped at all depends on whether the theory needs it — that's an advisor conversation, not a statistics one.
- This run fixed the factor count at five because that's how the questionnaire was designed. A different question — how many factors this data would produce on its own — needs a different, unconstrained run.
- Reliability (whether items behave consistently) is a separate check from validity (whether they measure the intended construct); if that's the open question, see how to run, interpret, and report Cronbach's alpha.
Frequently Asked Questions
My loading cleared .40 — does that mean the item is fine?
Not necessarily. A loading above .40 with no cross-loading rules out one failure mode, but communality is a separate check — the share of an item's variance the factors account for. In this run, nineteen items sat between .650 and .755 on communality; the one that didn't fit had a loading of .347 (already below .40) and a communality of .147, so both checks flagged it here, but a loading pass alone isn't the full picture.
What's the difference between a factor loading and a communality?
A loading is how strongly one item connects to one specific factor. Communality is how much of that item's total variance is explained across all the extracted factors combined. An item can theoretically clear a loading cutoff and still have a low communality if its explained variance is spread thin; in this run the same item was low on both.
Can I edit responses or drop participants to push a loading over .40?
No. That changes what the data says rather than reading it accurately, and it's not worth the exposure. The documented option here was to exclude the weak item from the composite score and retain the ones that behaved as designed, with a confirmatory follow-up analysis suggested as the next validation step.
Why don't the factor numbers match my construct order — for example, why is Attitude "factor 5" instead of first?
Factor numbers from an extraction are arbitrary; they don't necessarily follow the order constructs were listed in the questionnaire. What matters is which items load together on the same factor, not which number that factor happens to be assigned.
Related Reading
Haven't run the analysis yet? Start with the exploratory factor analysis walkthrough that produced these same tables. For the reliability side of a questionnaire — a different construct from validity — see how to run, interpret, and report Cronbach's alpha. For the wider reliability-and-validity picture, see a broader questionnaire workflow.
Bottom Line
Reading a factor loading interpretation correctly means checking two columns, not one: the loading itself, and communality. One item here cleared the cross-loading check and still failed — a loading of .347 and a communality of .147 — because communality is the column most write-ups skip.
Read your own factor analysis output in ChatSRS — upload your survey data and get the loading matrix and communality column read back in plain English.