Statistical Tutorial ·
Mann-Whitney or Kruskal-Wallis? How to Choose, and How to Run Both Online
Two independent questions decide which nonparametric test you need: how many groups you are comparing, and whether the outcome is normal enough for a mean. A full walkthrough of running Kruskal-Wallis and Mann-Whitney U in one pass. Demo data, N = 290.
The choice is made by two separate questions, not one: how many independent groups you are comparing decides between Mann-Whitney U (two) and Kruskal-Wallis (three or more), while how skewed the outcome is decides whether you are in the nonparametric family at all. Below is a walkthrough of both tests, run in one pass on demo data (N = 290).
The Two Questions People Collapse Into One
"Which test should I use?" gets answered badly because two independent judgments get merged into a single decision. They are not the same judgment and they do not depend on each other:
| The question | What it decides | This run |
|---|---|---|
| Is the outcome normal enough for means to describe it? | Parametric family (t-test, ANOVA) or nonparametric family (Mann-Whitney U, Kruskal-Wallis) | Strongly right-skewed with an extreme retained value → nonparametric |
| How many independent groups am I comparing? | Within whichever family: two groups or three-plus | Two groups (gender) and three groups (usage frequency) — both, in one file |
Source: the decision structure applied in the ChatSRS run described below, on simulated survey data, N = 290 (demo data, not real thesis data).
Note what the second row makes obvious: the same dataset can need both tests at once, because the group-count question is asked per comparison, not per file. That is exactly what happened here.
When an outcome is badly skewed, the mean stops describing anyone. Nonparametric tests compare rank distributions instead — Kruskal-Wallis for three or more groups, Mann-Whitney U for two.
Demo data, not real thesis data. A simulated survey, uploaded as mock-data-b3-en.xlsx, cleaned down to a working sample of 290 respondents before any test ran. The outcome is hours per week using AI tools.
Asking for the Justification Before the Result
I uploaded the file and typed one line: "Run a nonparametric test. Hours per week using AI tools is not very normal, so I want to compare the low, medium and high usage groups, and also compare men and women. Start by telling me why a nonparametric test is the right choice here rather than a t-test and ANOVA." The last sentence is the one worth stealing — asking for the justification before the result is what stops you pasting a test you cannot defend.
It answered the justification first, then named both tests: "A nonparametric approach is appropriate because weekly AI-tool hours is strongly right-skewed and contains an extreme retained value, making mean-based normal-theory comparisons less reliable. I'll use the Kruskal-Wallis test for the three independent usage groups and the Mann-Whitney U test for the two gender groups, using the same cleaned sample of 290 respondents."
Both axes, resolved out loud: the skew answers the family question, the group counts answer the test question, and the two answers are given separately.
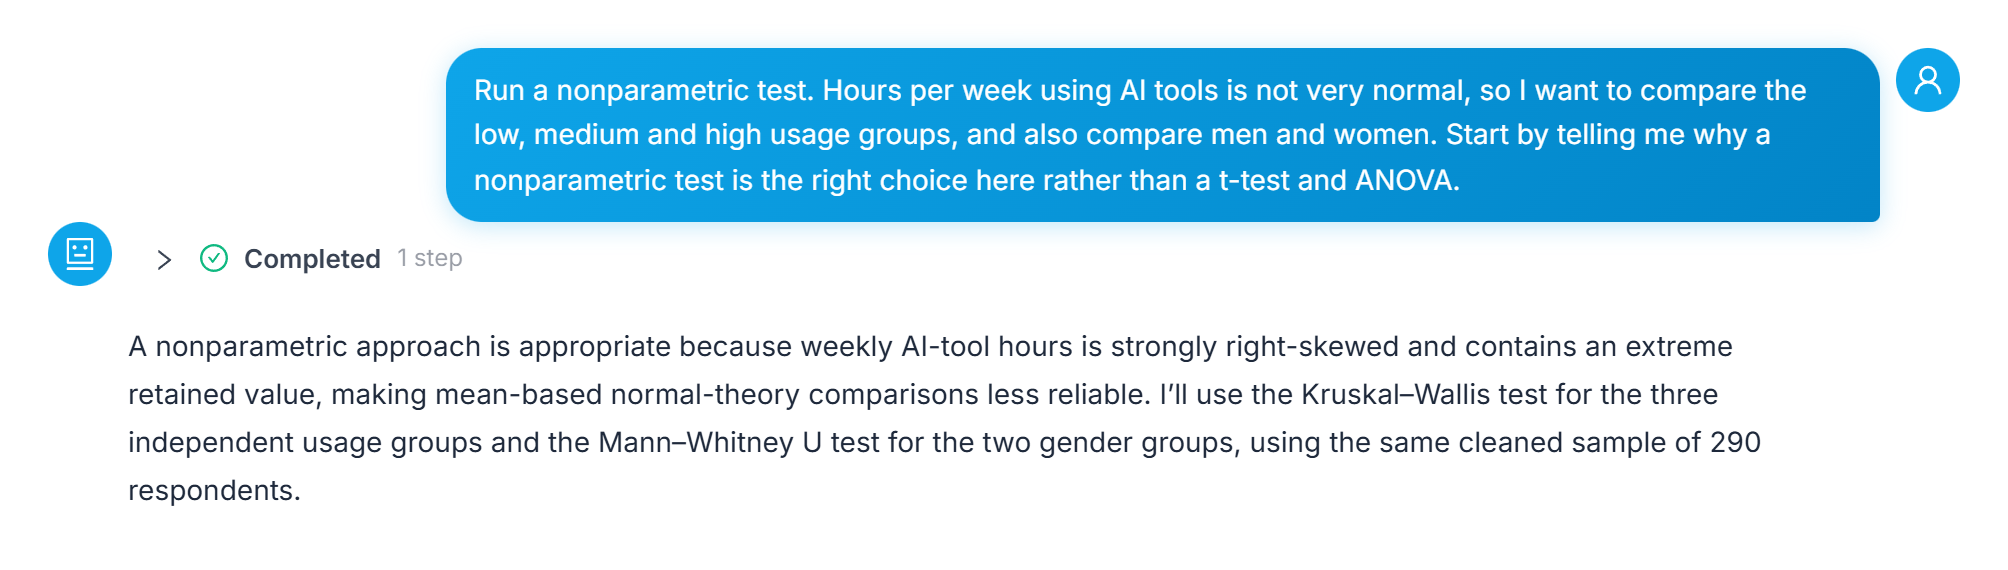 The prompt and the justification it produced before any test ran — the reasoning arrives ahead of the numbers.
It Caught Its Own Missing Comparison
Halfway through, it flagged its own miss: "The combined command did not evaluate both grouping variables: the tool interpreted the comma-separated name as one fuzzy-matched column and ran only the gender comparison. I'm running the missing three-group comparison separately with the exact variable name; the gender result already completed successfully."
Nobody asked a second time. It reread its own output, found one of my two comparisons missing, and went back for it.
 The self-correction in full — the first clause reports the miss, the second is the rerun that makes it a correction rather than a failure notice.
Both Tables, Side by Side
| Mann-Whitney U test | Female(n=152) | Male(n=138) | U | z | p | r |
|---|---|---|---|---|---|---|
| Hours per week using AI tools, M(P25,P75) | 4.900(2.800, 8.725) | 4.950(2.700, 8.375) | 10420.0 | -0.095 | 0.925 | 0.006 |
| Kruskal-Wallis H test | A.High(n=96) | B.Low(n=92) | C.Medium(n=102) | H | p | η² |
|---|---|---|---|---|---|---|
| Hours per week using AI tools, M(P25,P75) | 8.550(5.300, 14.675) | 2.450(1.700, 3.925) | 4.800(3.225, 7.100) | 100.274 | <0.001** | 0.347 |
Source: ChatSRS "Mann-Whitney U Test" and "Kruskal-Wallis H Test" output on simulated survey data, N = 290 (demo data, not real thesis data). Group sizes are printed inside the column headers, and the columns appear in the source order A.High, B.Low, C.Medium.
Two tests, two structures. Medians with their quartiles rather than means with standard deviations, because these tests rank rather than average.
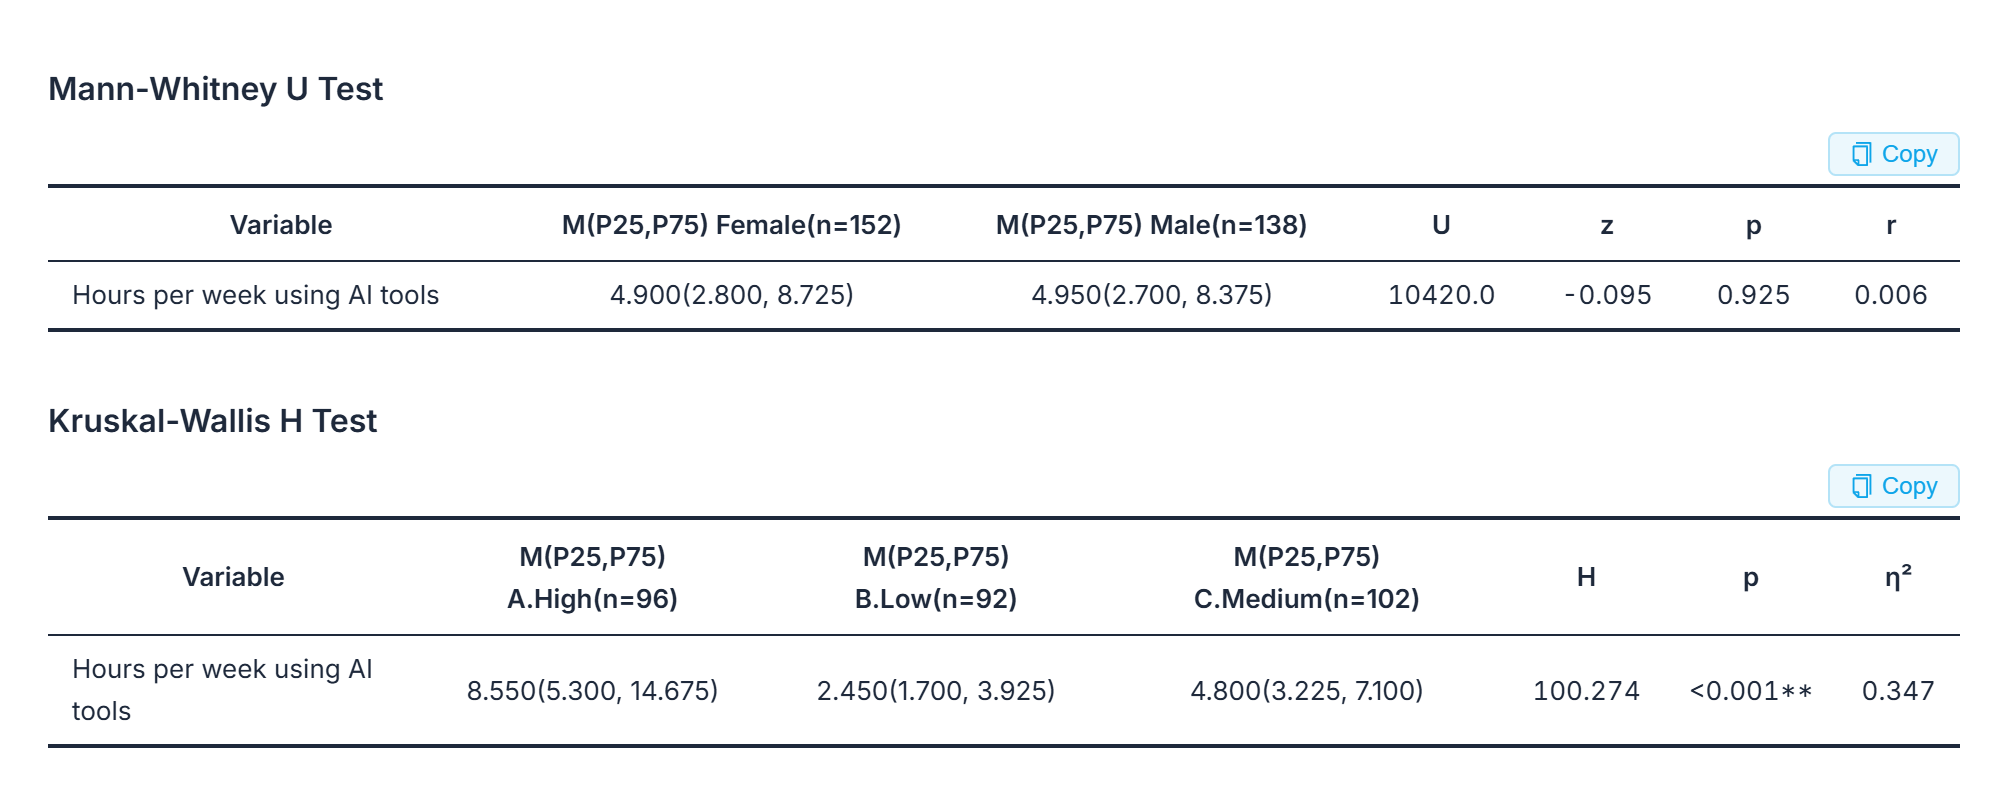 The two tables as returned — the group sizes live inside the column headers, which is why the headers have to stay in frame.
The Write-Up, and the Limit It States Itself
On the three groups: "The Kruskal-Wallis test showed a statistically significant difference in weekly AI-tool use across the three groups, H(2) = 100.274, p < .001." Followed immediately by the limit: "This is an omnibus result, indicating that at least two groups differ. Pairwise post-hoc comparisons would be needed to determine specifically whether each pair of groups differs significantly."
On gender: "The Mann-Whitney U test found no statistically significant difference between women and men in weekly AI-tool use, U = 10,420.0, z = -0.095, p = .925."
In plain terms: these tests rank everyone from lowest to highest and compare the ranks, which is why an extreme value cannot drag the result around the way it drags a mean. Medians with their quartiles, not means with standard deviations, are what you report from them. Check the AI's reasoning yourself before any of this becomes a sentence in your thesis.
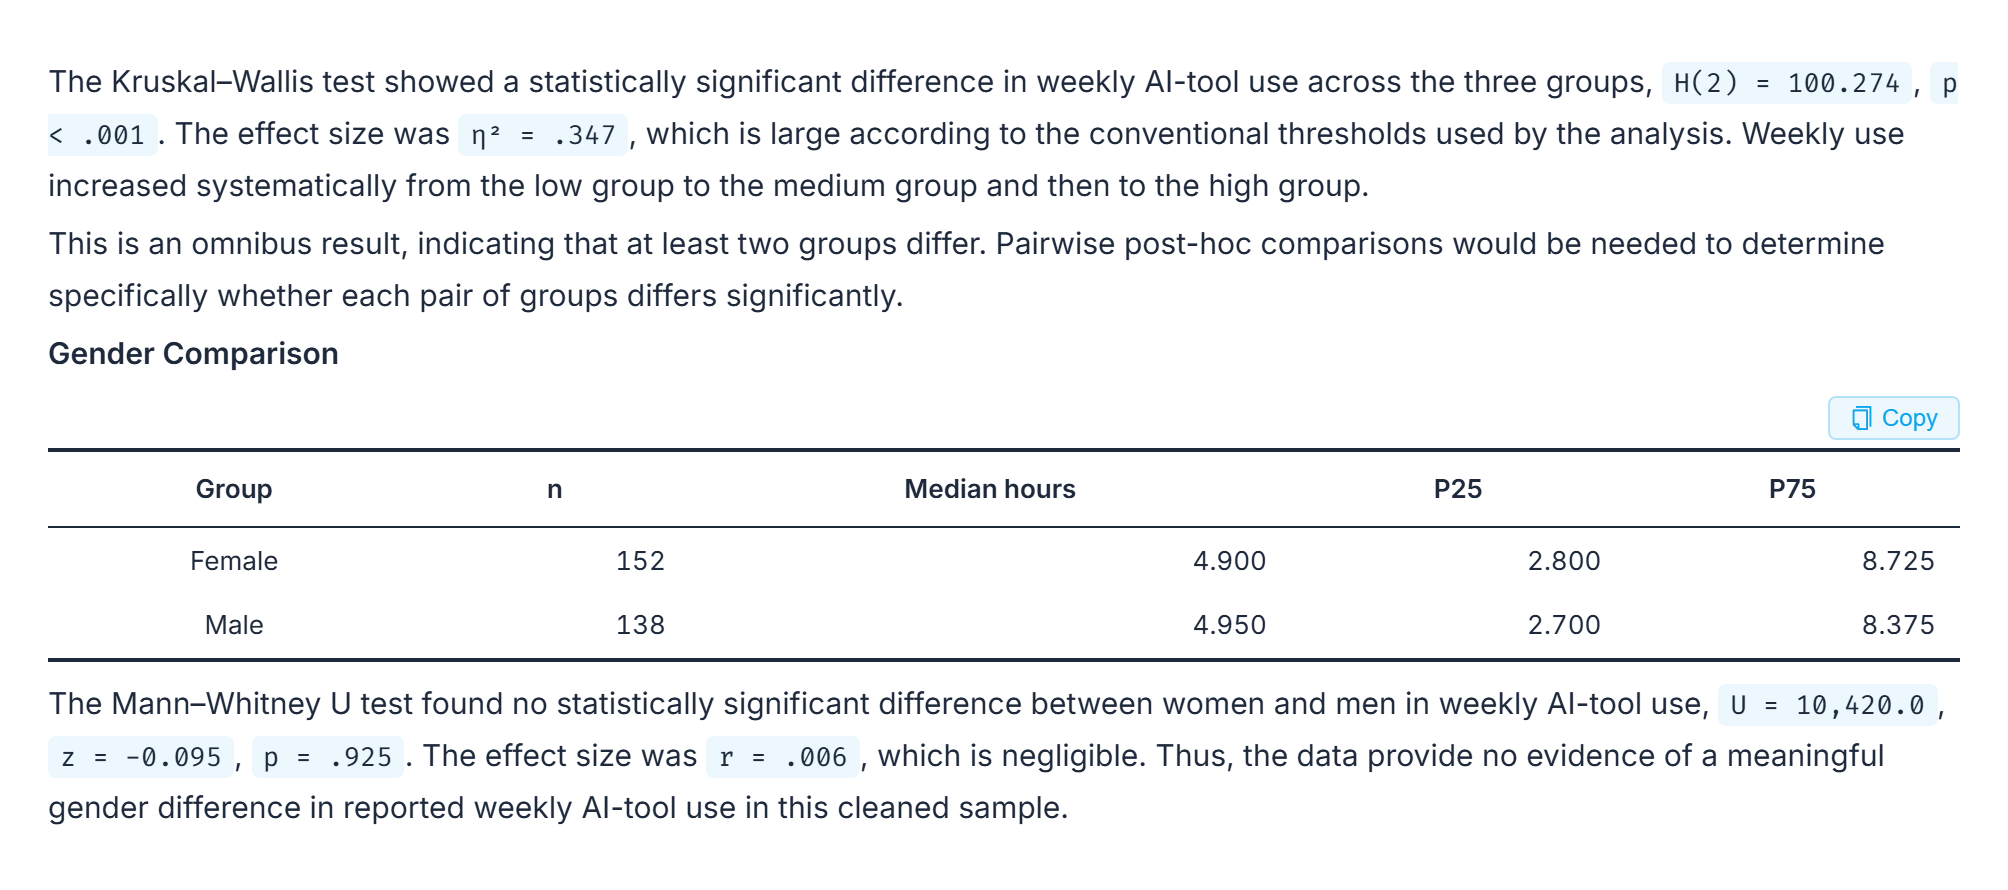 A significant omnibus result with its own stated limit, sitting next to a null result reported without hedging.
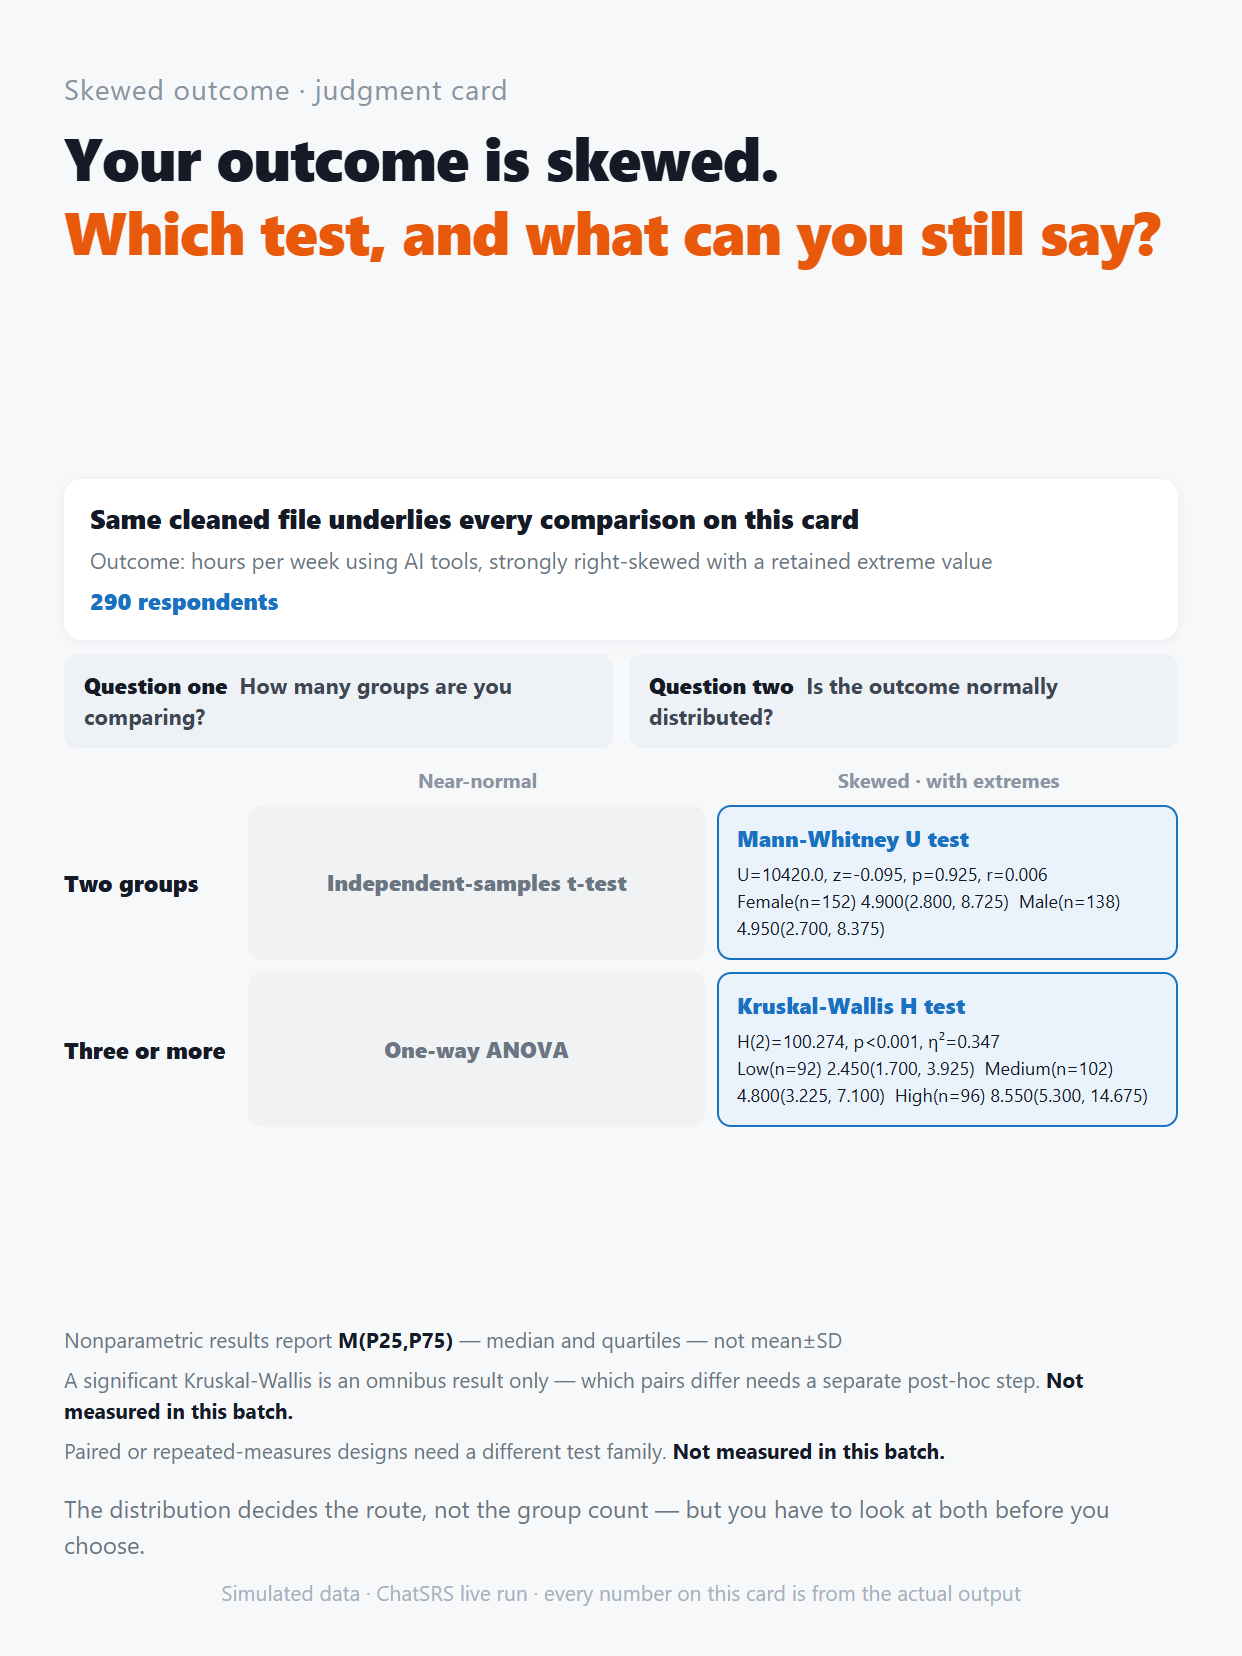 A judgment card for your own data — group count first, then what each result does and does not license you to write.
What This Walkthrough Doesn't Cover
- Reading a significant H and a null U side by side, and writing both up without overclaiming either — that is covered in what a significant Kruskal-Wallis actually establishes.
- The parametric route this run deliberately avoided; comparing two groups on a roughly normal outcome is walked through in running an independent-samples t-test online.
- The three-group parametric equivalent, with its own post-hoc step; see running an ANOVA online with APA output.
- Pairwise post-hoc comparisons after Kruskal-Wallis. This run did not produce any, and none is implied here.
Frequently Asked Questions
How do I decide between Mann-Whitney U and Kruskal-Wallis?
By group count alone. Two independent groups take Mann-Whitney U; three or more take Kruskal-Wallis. Whether your outcome is skewed is a separate question that decides whether you are choosing between these two tests at all rather than between a t-test and an ANOVA.
Can one dataset need both tests?
Yes, and this run is an example. The group-count question is asked once per comparison, not once per file — gender gave two groups and usage frequency gave three, so both tests ran on the same 290-respondent sample.
Why report medians and quartiles instead of means?
Because the tests rank respondents rather than averaging them, and a single extreme value cannot drag a rank the way it drags a mean. This run reports M(P25,P75) for each group — for example B.Low(n=92) at 2.450(1.700, 3.925) against A.High(n=96) at 8.550(5.300, 14.675).
My Kruskal-Wallis is significant. Which groups differ?
Not established by the test. The output said so itself: "This is an omnibus result, indicating that at least two groups differ. Pairwise post-hoc comparisons would be needed to determine specifically whether each pair of groups differs significantly." That is a separate step, and this run did not produce one.
What should I do about a non-significant Mann-Whitney U?
Report it with its statistic and effect size rather than as "no difference". Here that is U = 10,420.0, z = -0.095, p = .925, alongside the two medians, so a reader can see how close the groups actually were.
Bottom Line
Two questions, asked separately, settle the whole choice: is the outcome describable by a mean, and how many groups am I comparing. Ask for the justification in the same prompt as the test, and the answer arrives with its own reasoning attached — including, on this run, a comparison it noticed it had dropped.
Run your own nonparametric test in ChatSRS — name your grouping variables and your outcome; the choice of test, the medians, and the effect sizes come back in the same pass.