Academic Reporting ·
Your Nonparametric Test Is Significant. Is the Result Actually Meaningful?
A Kruskal-Wallis result of H(2) = 100.274, p < .001 looks decisive and still leaves three questions open: which groups, how much, and what the grouping variable is made of. One real output read line by line, including the null result next to it. Demo data, N = 290.
A significant Kruskal-Wallis result establishes exactly one thing: at least two of your groups differ. It does not name which two, it does not tell you whether the grouping variable was worth testing, and it never did. Below is one output read line by line, including the null result next to it, on demo data (N = 290).
What This Guide Covers
A significant Kruskal-Wallis result is the most over-read number in survey statistics. This is the results-reading companion to choosing and running a nonparametric test — same simulated survey, same 290-respondent sample, same two comparisons. That page covers deciding which test you need; this one covers what the output does and does not license you to write.
The run behind it is demo data — not real thesis data. A simulated survey, uploaded as mock-data-b3-en.xlsx, cleaned down to a working sample of 290 respondents. The outcome is hours per week using AI tools, compared first across three usage-frequency groups and then across gender.
Start With the Descriptive the Test Is Built On
The three-group table reports medians with their quartiles, not means.
| Kruskal-Wallis H test | A.High(n=96) | B.Low(n=92) | C.Medium(n=102) | H | p | η² |
|---|---|---|---|---|---|---|
| Hours per week using AI tools, M(P25,P75) | 8.550(5.300, 14.675) | 2.450(1.700, 3.925) | 4.800(3.225, 7.100) | 100.274 | <0.001** | 0.347 |
Source: ChatSRS "Kruskal-Wallis H Test" output on simulated survey data, N = 290 (demo data, not real thesis data). Group sizes are printed inside the column headers; the columns appear in the source order A.High, B.Low, C.Medium.
Read low to high, that is 2.450(1.700, 3.925), then 4.800(3.225, 7.100), then 8.550(5.300, 14.675). Medians with quartiles are the correct descriptive to pair with this test, and they are the ones people quietly swap for a mean when they write up.
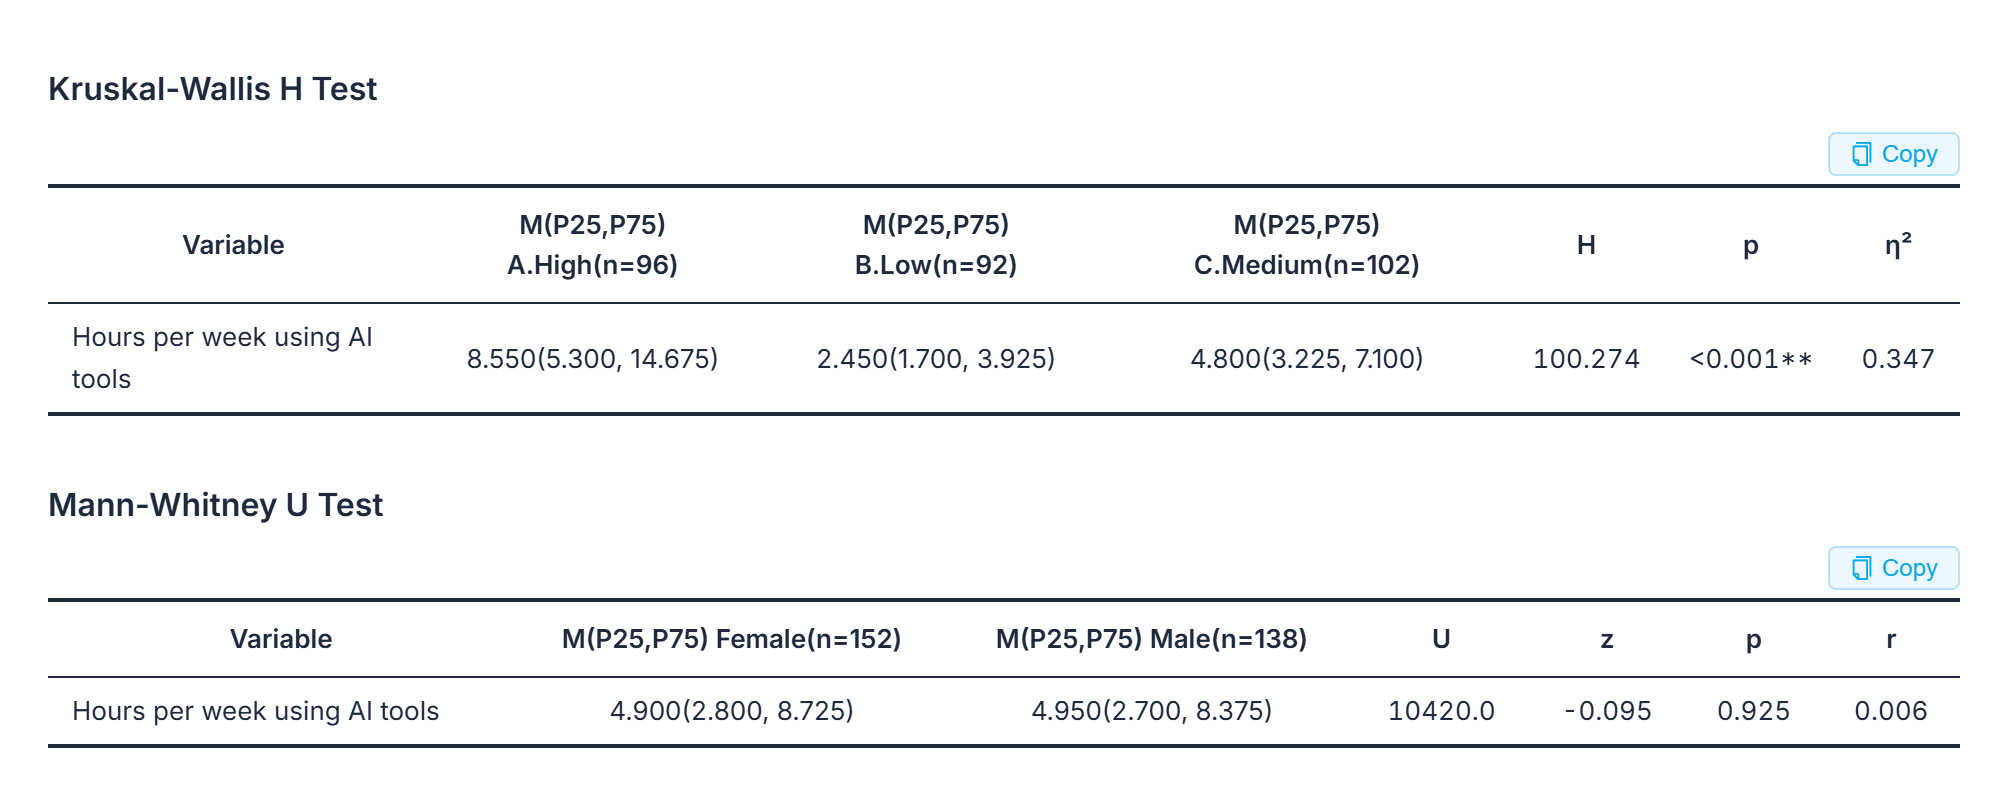 Both tables as returned. The n for every group lives inside a column header, which is why the headers cannot be cropped away.
The Verdict, and the Sentence Most Write-Ups Skip
The verdict: "The Kruskal-Wallis test showed a statistically significant difference in weekly AI-tool use across the three groups, H(2) = 100.274, p < .001." Then the size, with its own caveat attached: "The effect size was η² = .347, which is large according to the conventional thresholds used by the analysis." Large by convention, not large by decree — the hedge is the product's, and it is the honest version.
The next sentence is the one most write-ups skip: "This is an omnibus result, indicating that at least two groups differ. Pairwise post-hoc comparisons would be needed to determine specifically whether each pair of groups differs significantly."
Nothing in H(2) = 100.274 licenses a claim about low versus medium specifically. That claim needs a separate test, and this run did not produce one.
 The omnibus caveat sits directly underneath the verdict — which is the whole reason it belongs in the same frame.
Before You Celebrate: What Is the Grouping Variable Made Of?
Here is the check that has nothing to do with the p-value. Look at the two variable names in this run as they are printed: the grouping variable is usage-frequency group, and the outcome is hours per week using AI tools. Both describe the same behaviour.
That observation is about the labels, not about the arithmetic — but it is the kind of thing worth noticing before a significant result goes into a discussion section. A test can only tell you that distributions differ; whether the difference is informative depends on how independent the grouping variable is from the thing being measured. If your groups were cut from the outcome itself, or from something that stands in for it, a decisive p-value confirms the cut rather than discovering a relationship.
| What to check | Why it matters | What to write if it fails |
|---|---|---|
| Does the test name specific groups? | A significant H is omnibus only | Report the omnibus result; do not name a pair you did not test |
| Is the effect size labelled by convention? | Thresholds are conventions, not verdicts | Quote the convention, as the output does with η² = .347 |
| Is the grouping variable independent of the outcome? | A grouping cut from the outcome guarantees a gap | Describe what the groups are made of, and treat the result as descriptive |
Source: the three limits stated or implied by the ChatSRS nonparametric output on simulated survey data, N = 290 (demo data, not real thesis data).
The Null Result Is Also a Result
The gender comparison came back the other way, and is reported without hedging.
| Mann-Whitney U test | Female(n=152) | Male(n=138) | U | z | p | r |
|---|---|---|---|---|---|---|
| Hours per week using AI tools, M(P25,P75) | 4.900(2.800, 8.725) | 4.950(2.700, 8.375) | 10420.0 | -0.095 | 0.925 | 0.006 |
Source: ChatSRS "Mann-Whitney U Test" output on simulated survey data, N = 290 (demo data, not real thesis data).
In its own words: "The Mann-Whitney U test found no statistically significant difference between women and men in weekly AI-tool use, U = 10,420.0, z = -0.095, p = .925. The effect size was r = .006, which is negligible."
A null result reported with its statistic and its effect size is a finding. A null result reported as "no difference" is a mistake — and here the two medians sitting side by side let a reader see how close the groups actually were.
 The null result written out with its statistic and effect size, rather than summarised as "no difference".
How to Write Both Rows Up
In plain terms: these tests rank every respondent from lowest to highest and compare the ranks, which is why a single extreme value cannot drag them the way it drags a mean. Report medians and quartiles, report the effect size in both directions, and treat a significant omnibus as an invitation to a further test rather than a conclusion. Check the AI's reasoning yourself before any of this becomes a sentence in your thesis.
What This Guide Doesn't Cover
- Deciding which nonparametric test your comparison needs in the first place — that is walked through in Mann-Whitney or Kruskal-Wallis, and how to choose.
- The parametric three-group equivalent and its APA wording; see reporting an ANOVA in APA 7.
- Handling a split result where one outcome moves and another does not, on the same grouping variable; that is covered in one outcome significant, the other not.
- Pairwise post-hoc comparisons. None was produced in this run, and no pairwise claim appears anywhere on this page.
Frequently Asked Questions
Does a significant Kruskal-Wallis mean my three groups all differ from each other?
No. It means at least two of them do. The output stated the limit itself: "Pairwise post-hoc comparisons would be needed to determine specifically whether each pair of groups differs significantly." Naming a specific pair without running that step is a claim the test never made.
Can a significant result still be uninformative?
It can. A p-value only reports that distributions differ; it cannot tell you whether the grouping variable was independent of the outcome to begin with. If your groups were defined using the outcome or a close proxy for it, a decisive result describes the way you cut the data rather than a discovery.
What does η² = .347 mean here?
It is the effect size for the three-group comparison, and the output labelled it carefully: "which is large according to the conventional thresholds used by the analysis." Conventional thresholds are conventions — quote the standard you are applying rather than asserting the effect is large.
How do I report a non-significant Mann-Whitney U without saying "no difference"?
Report the statistic and the effect size, and put the two medians next to each other. In this run: U = 10,420.0, z = -0.095, p = .925, r = .006, with Female(n=152) at 4.900(2.800, 8.725) against Male(n=138) at 4.950(2.700, 8.375).
Why medians and quartiles rather than means and standard deviations?
Because the test compares ranks. Reporting a mean alongside a rank-based test describes a quantity the test never used, and it reintroduces exactly the sensitivity to extreme values the test was chosen to avoid.
Bottom Line
Three questions survive a significant nonparametric result: which groups actually differ, how large the difference is by whose convention, and what the grouping variable is made of. The output answered the second, flagged the first as unanswered, and left the third to you.
Read your own nonparametric output in ChatSRS — get medians, effect sizes, and the limits stated in wording you can adapt for a results section.